Bringing clarity to warehouse operations at Smurfit Westrock
At Smurfit Westrock, corrugated packaging moves from production lines into warehouses and onward to customers. Each pallet needs a known location, an assigned task and a place in the shipment plan. The tools supporting that work had to serve forklift drivers in the warehouse and coordinators planning loads at a desk.
Over a one-year engagement, I led product design across field research, strategy, workflows, the warehouse MVP and a shared Design System. I worked with product owners, warehouse staff and an eight-person development team to turn an unclear brief into a sequence of decisions the team could deliver.
The starting point: a twenty-year-old system and no shared roadmap
The legacy application ran on rugged touch devices mounted on forklifts. Operators also relied on barcode scanners, zone labels on the floor and knowledge passed between shifts. Scanning recorded a movement, but did not reliably tell a driver where a pallet should go or help a coordinator see what needed attention next.
My first task was to understand that operation before redesigning it. Drivers needed clear instructions that worked in a fast, physical environment; coordinators needed a way to plan, assign and revise work. Product and engineering needed agreed priorities and milestones so that interface decisions could move forward together.
Client
Smurfit Westrock
Role
Product Designer
Focus
Warehouse logistics
Enterprise UXScope
Research, strategy, UX/UI and Design System
01 · Field research
The warehouse floor was the source of truth
I visited the Córdoba warehouse to follow pallets from the production line through storage and truck loading. I observed the forklift-mounted tablet and scanner in use, and spoke with drivers and coordinators about how they handled a normal shift and unexpected changes.
The recurring problem was the gap between a recorded scan and an actionable plan. A pallet could be in the system yet still be difficult to locate or awkwardly placed for its next shipment. Drivers compensated with local knowledge; monthly stock counts helped reconcile discrepancies. These observations shaped the questions we later took to teams in other plants.
The interface extended beyond the screen
Drivers moved between a mounted touch device, a handheld scanner and physical zone labels. Each step had to match the actual pallet movement.
Every shift had its own logic
Morning and afternoon teams had different habits for placing and finding pallets. The software did little to make those decisions consistent.
Scanning did not create visibility
A scan identified a pallet, but drivers still needed to know its destination, the available space and when it would be collected.
Recovery had become routine
When locations became uncertain, staff had to search and recount stock. Monthly inventory checks exposed the cost of that missing visibility.
02 · Research strategy
Turning assumptions into evidence
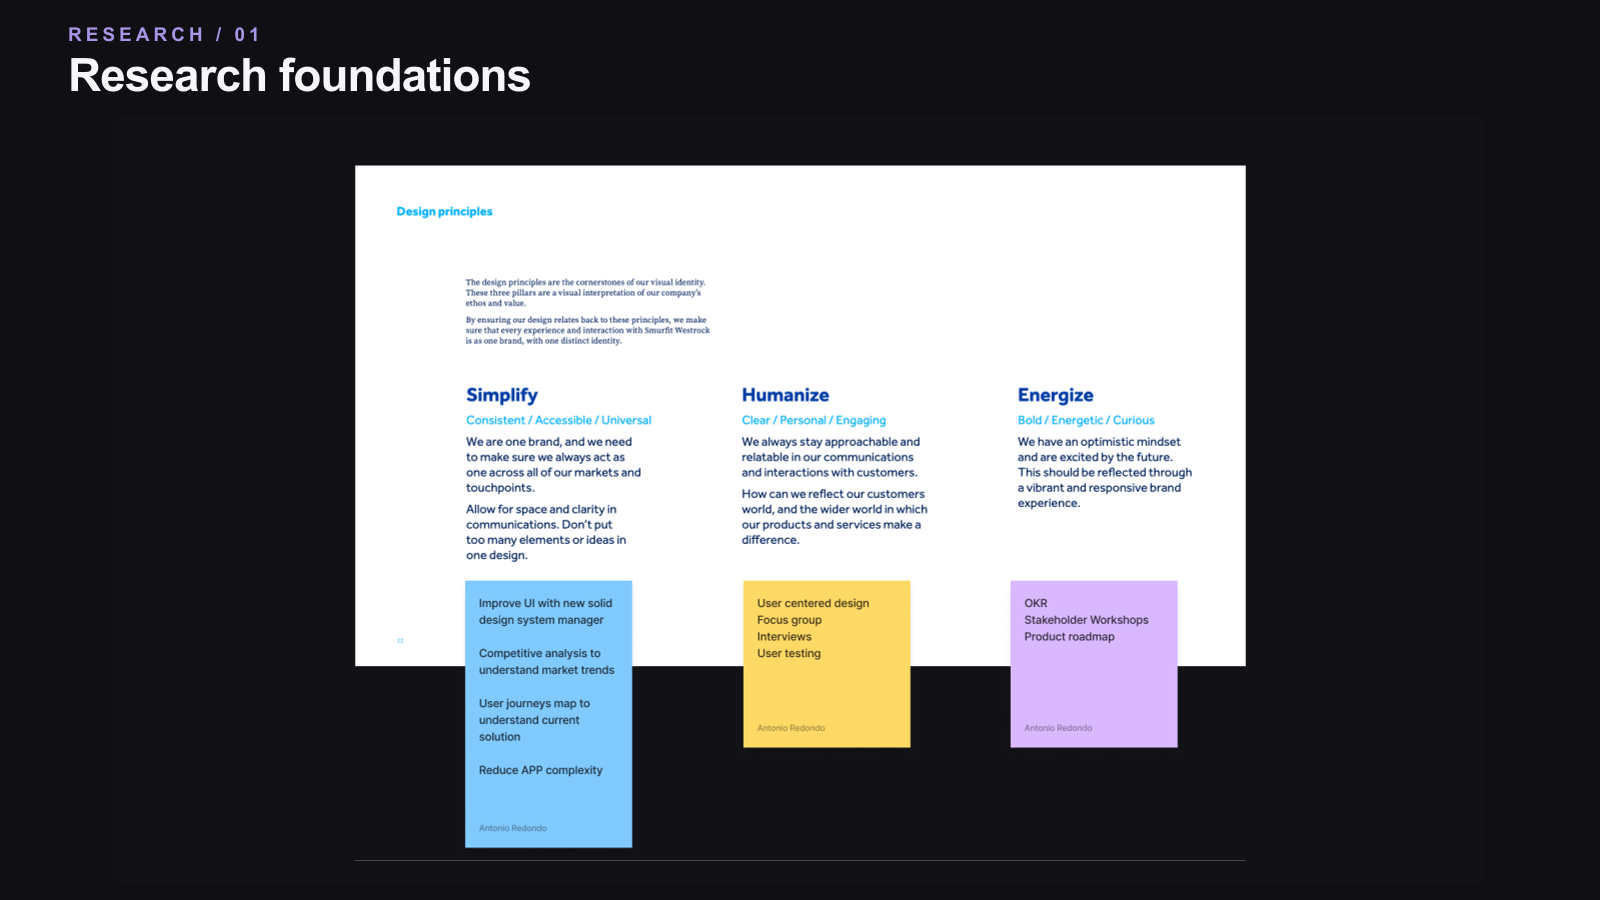
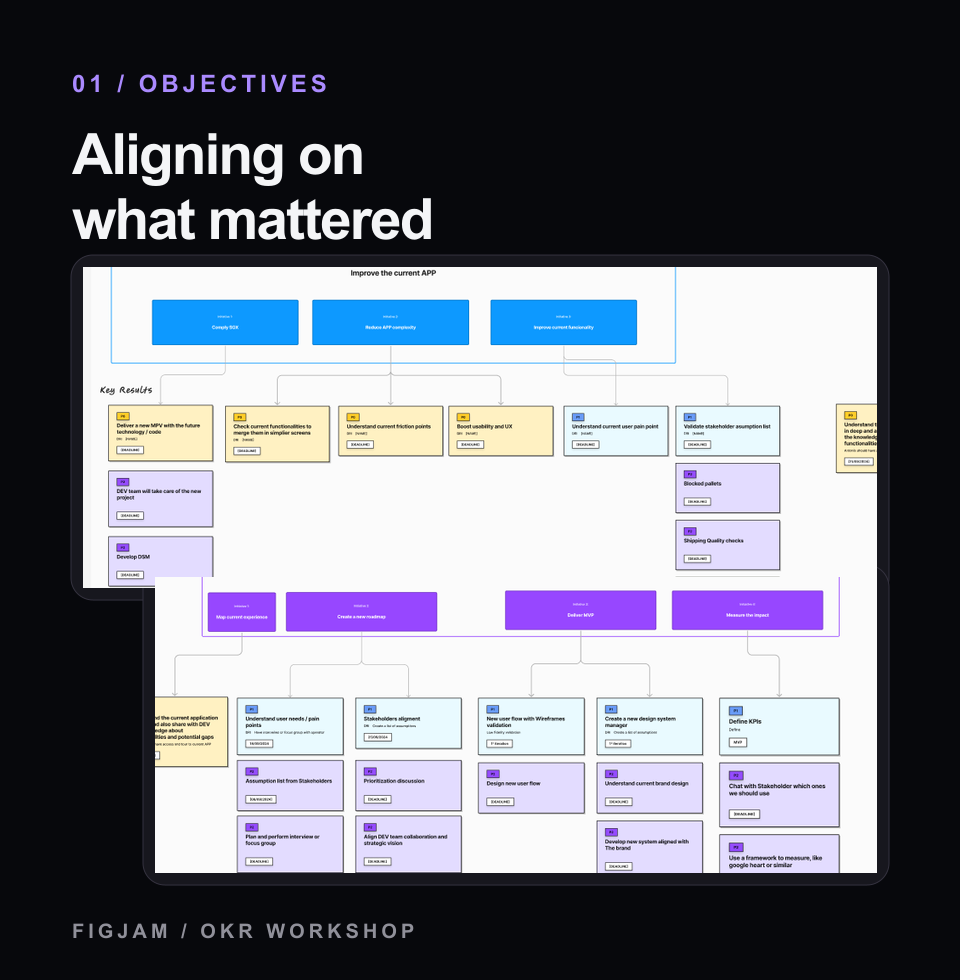
I laid out the research sequence in FigJam so product owners, stakeholders and developers could see what we needed to learn and why. I connected company priorities and urgent warehouse needs to proposed objectives, then made the team's assumptions explicit before treating them as requirements.
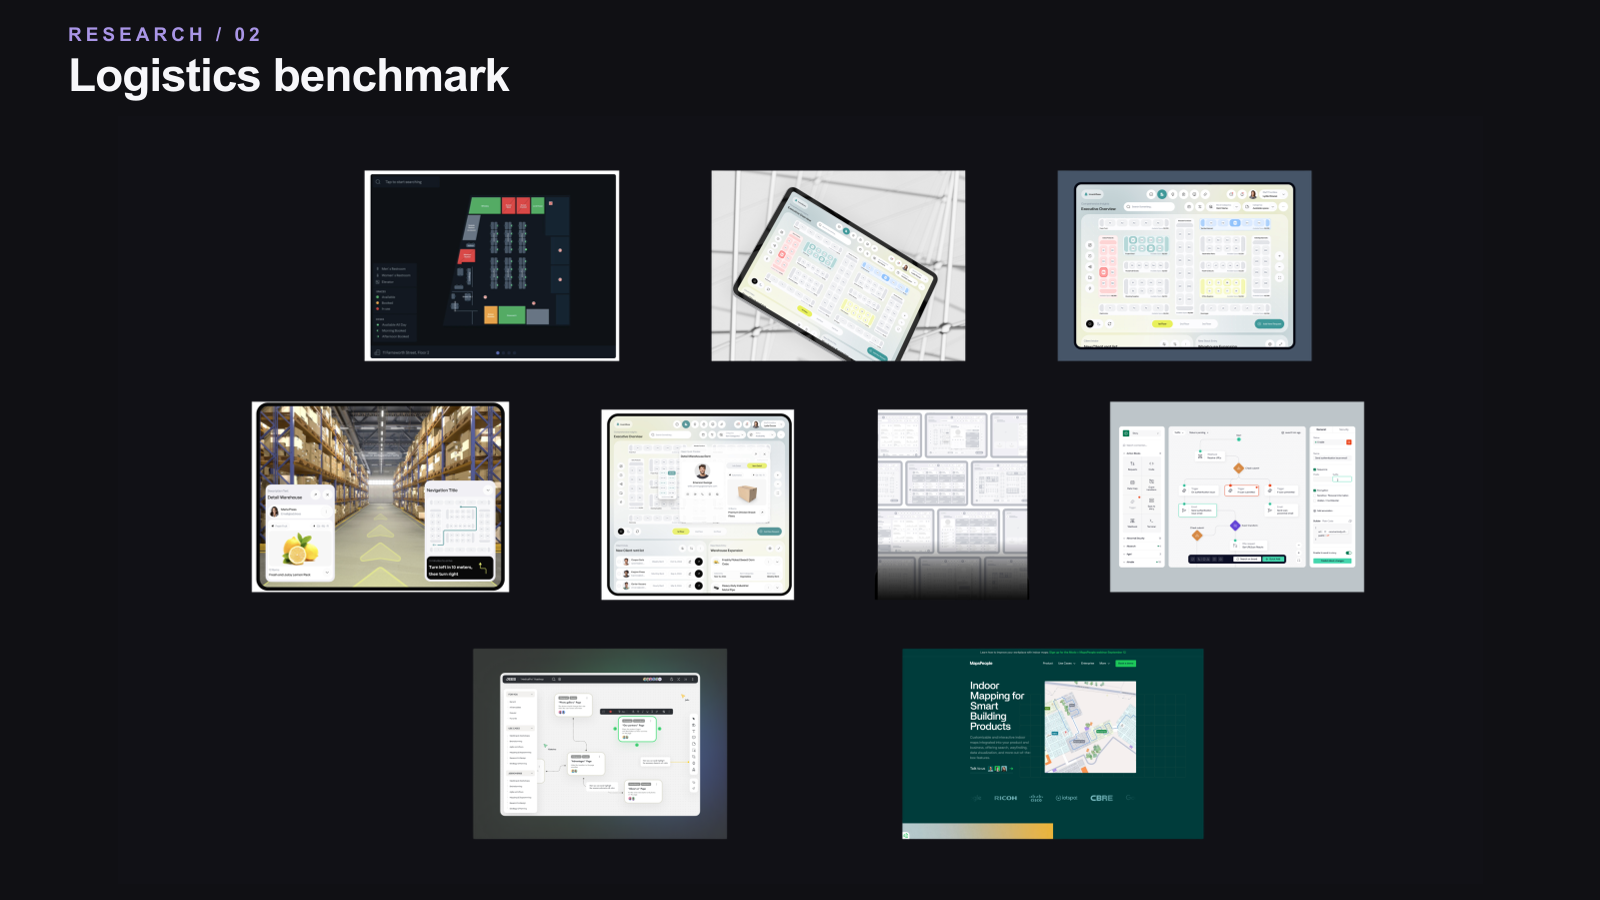
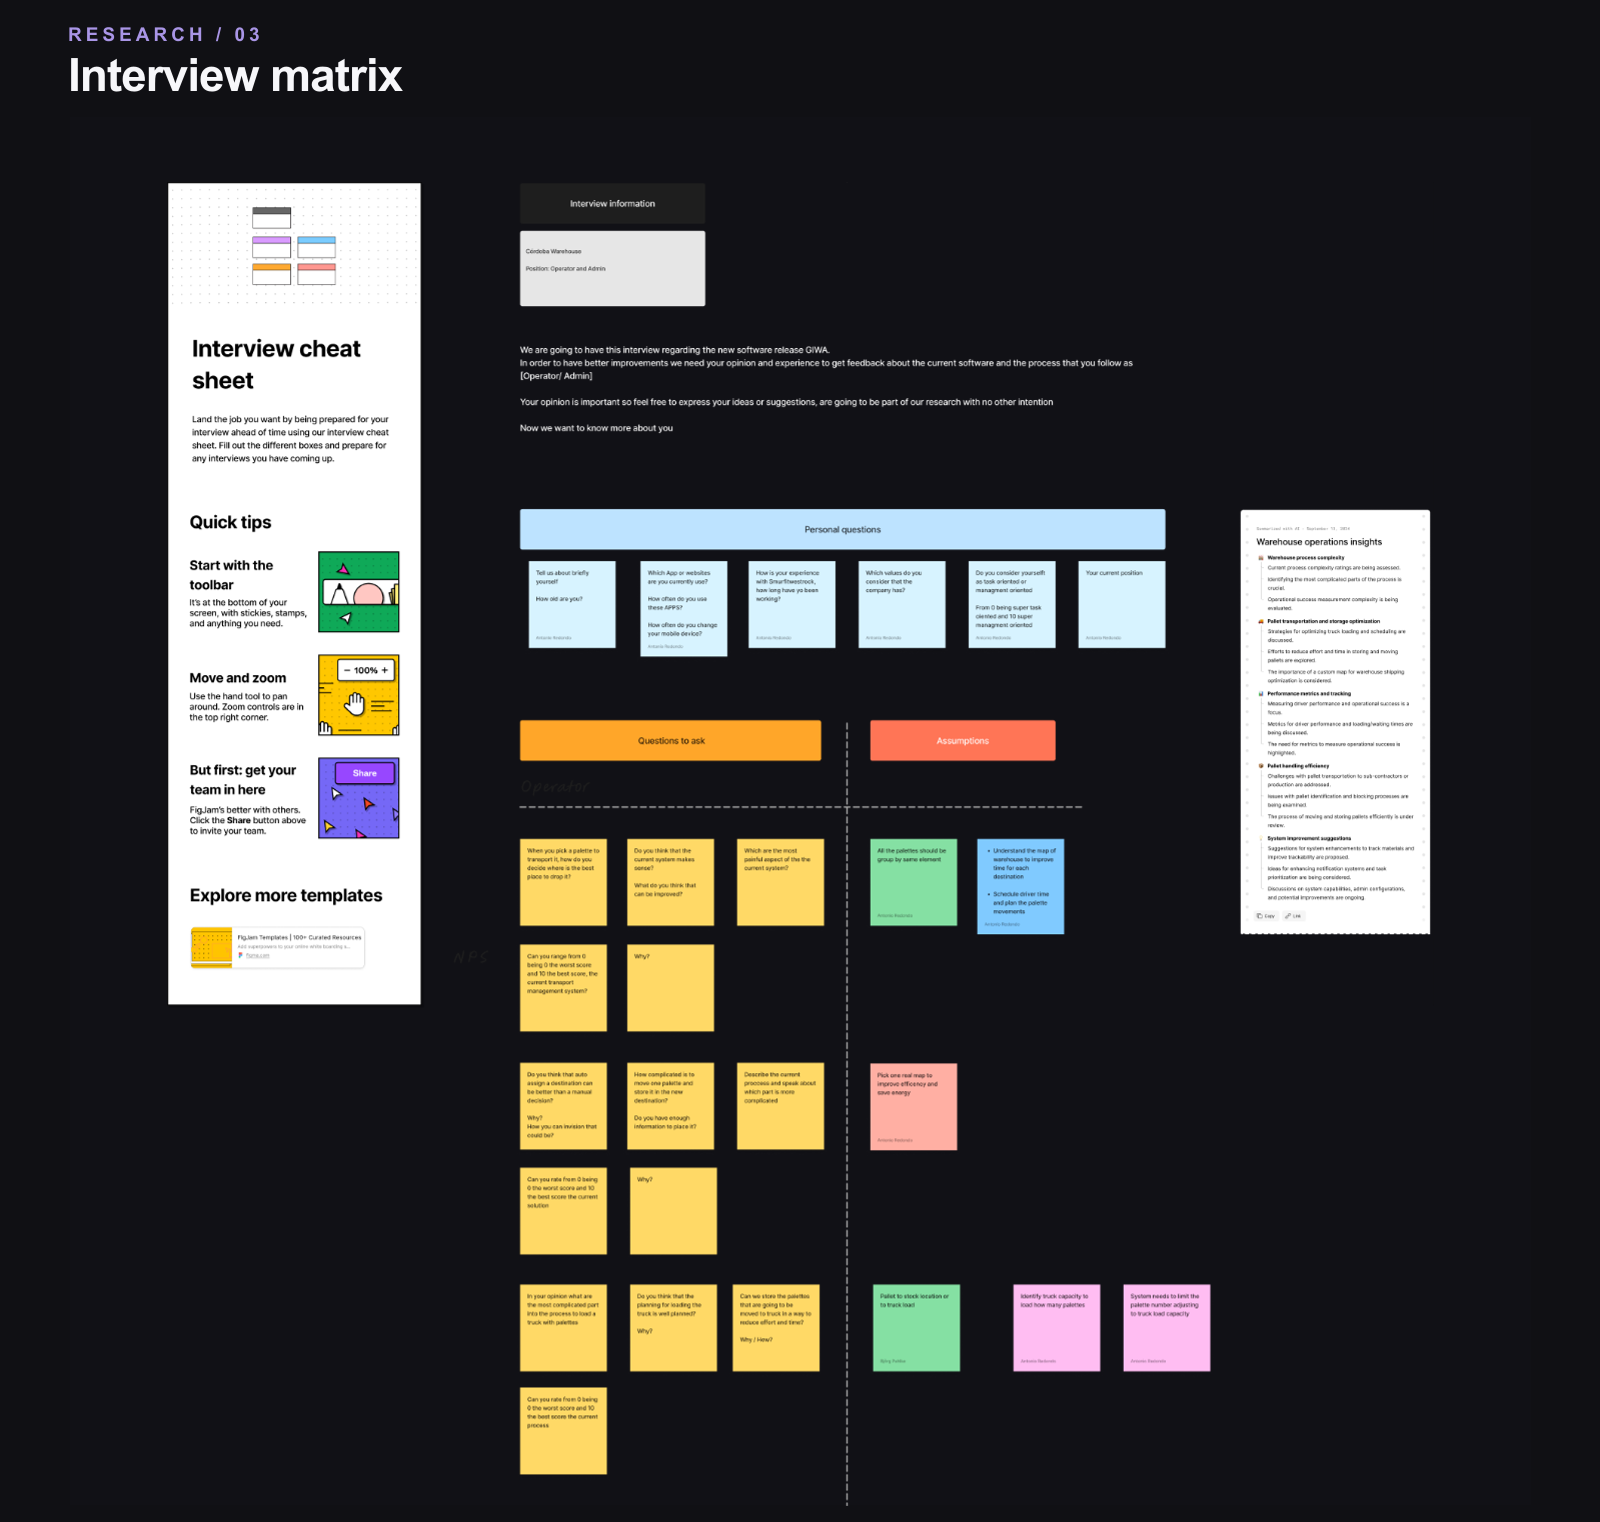
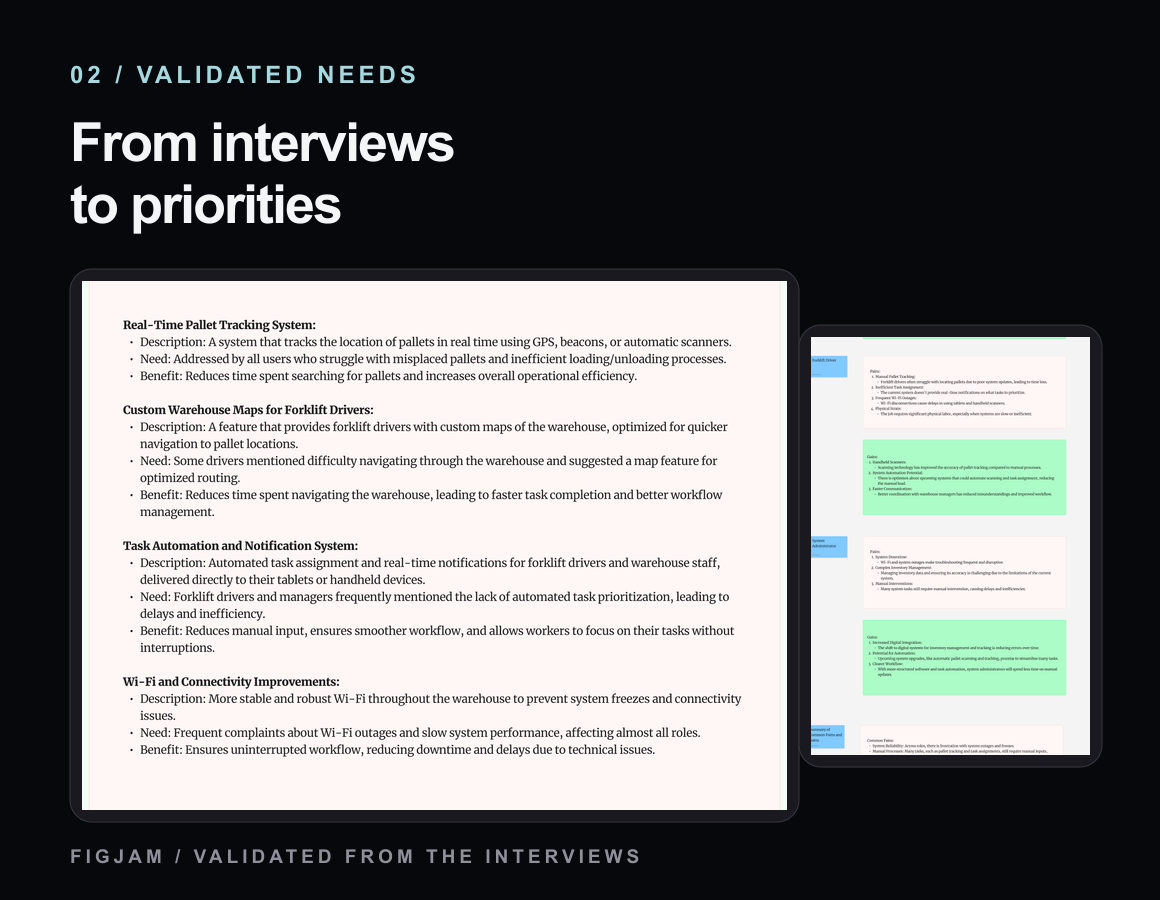
I reviewed logistics products and adjacent tracking approaches to understand possible patterns, including location visibility and automation. Those ideas informed a role-specific interview matrix with qualitative and quantitative questions. Conversations with warehouse teams across countries helped us test assumptions and distinguish recurring needs from local practices.
- Align the questions: relate company priorities and operational problems to the objectives the product should address.
- Assess possible approaches: discuss benchmark findings and technical feasibility with product and engineering.
- Test assumptions by role: ask drivers and coordinators about current tasks, workarounds and unmet needs.
- Use the findings: synthesise interviews into personas, feature priorities and a phased product direction.


03 · Define
One platform, different responsibilities
Personas grounded in research
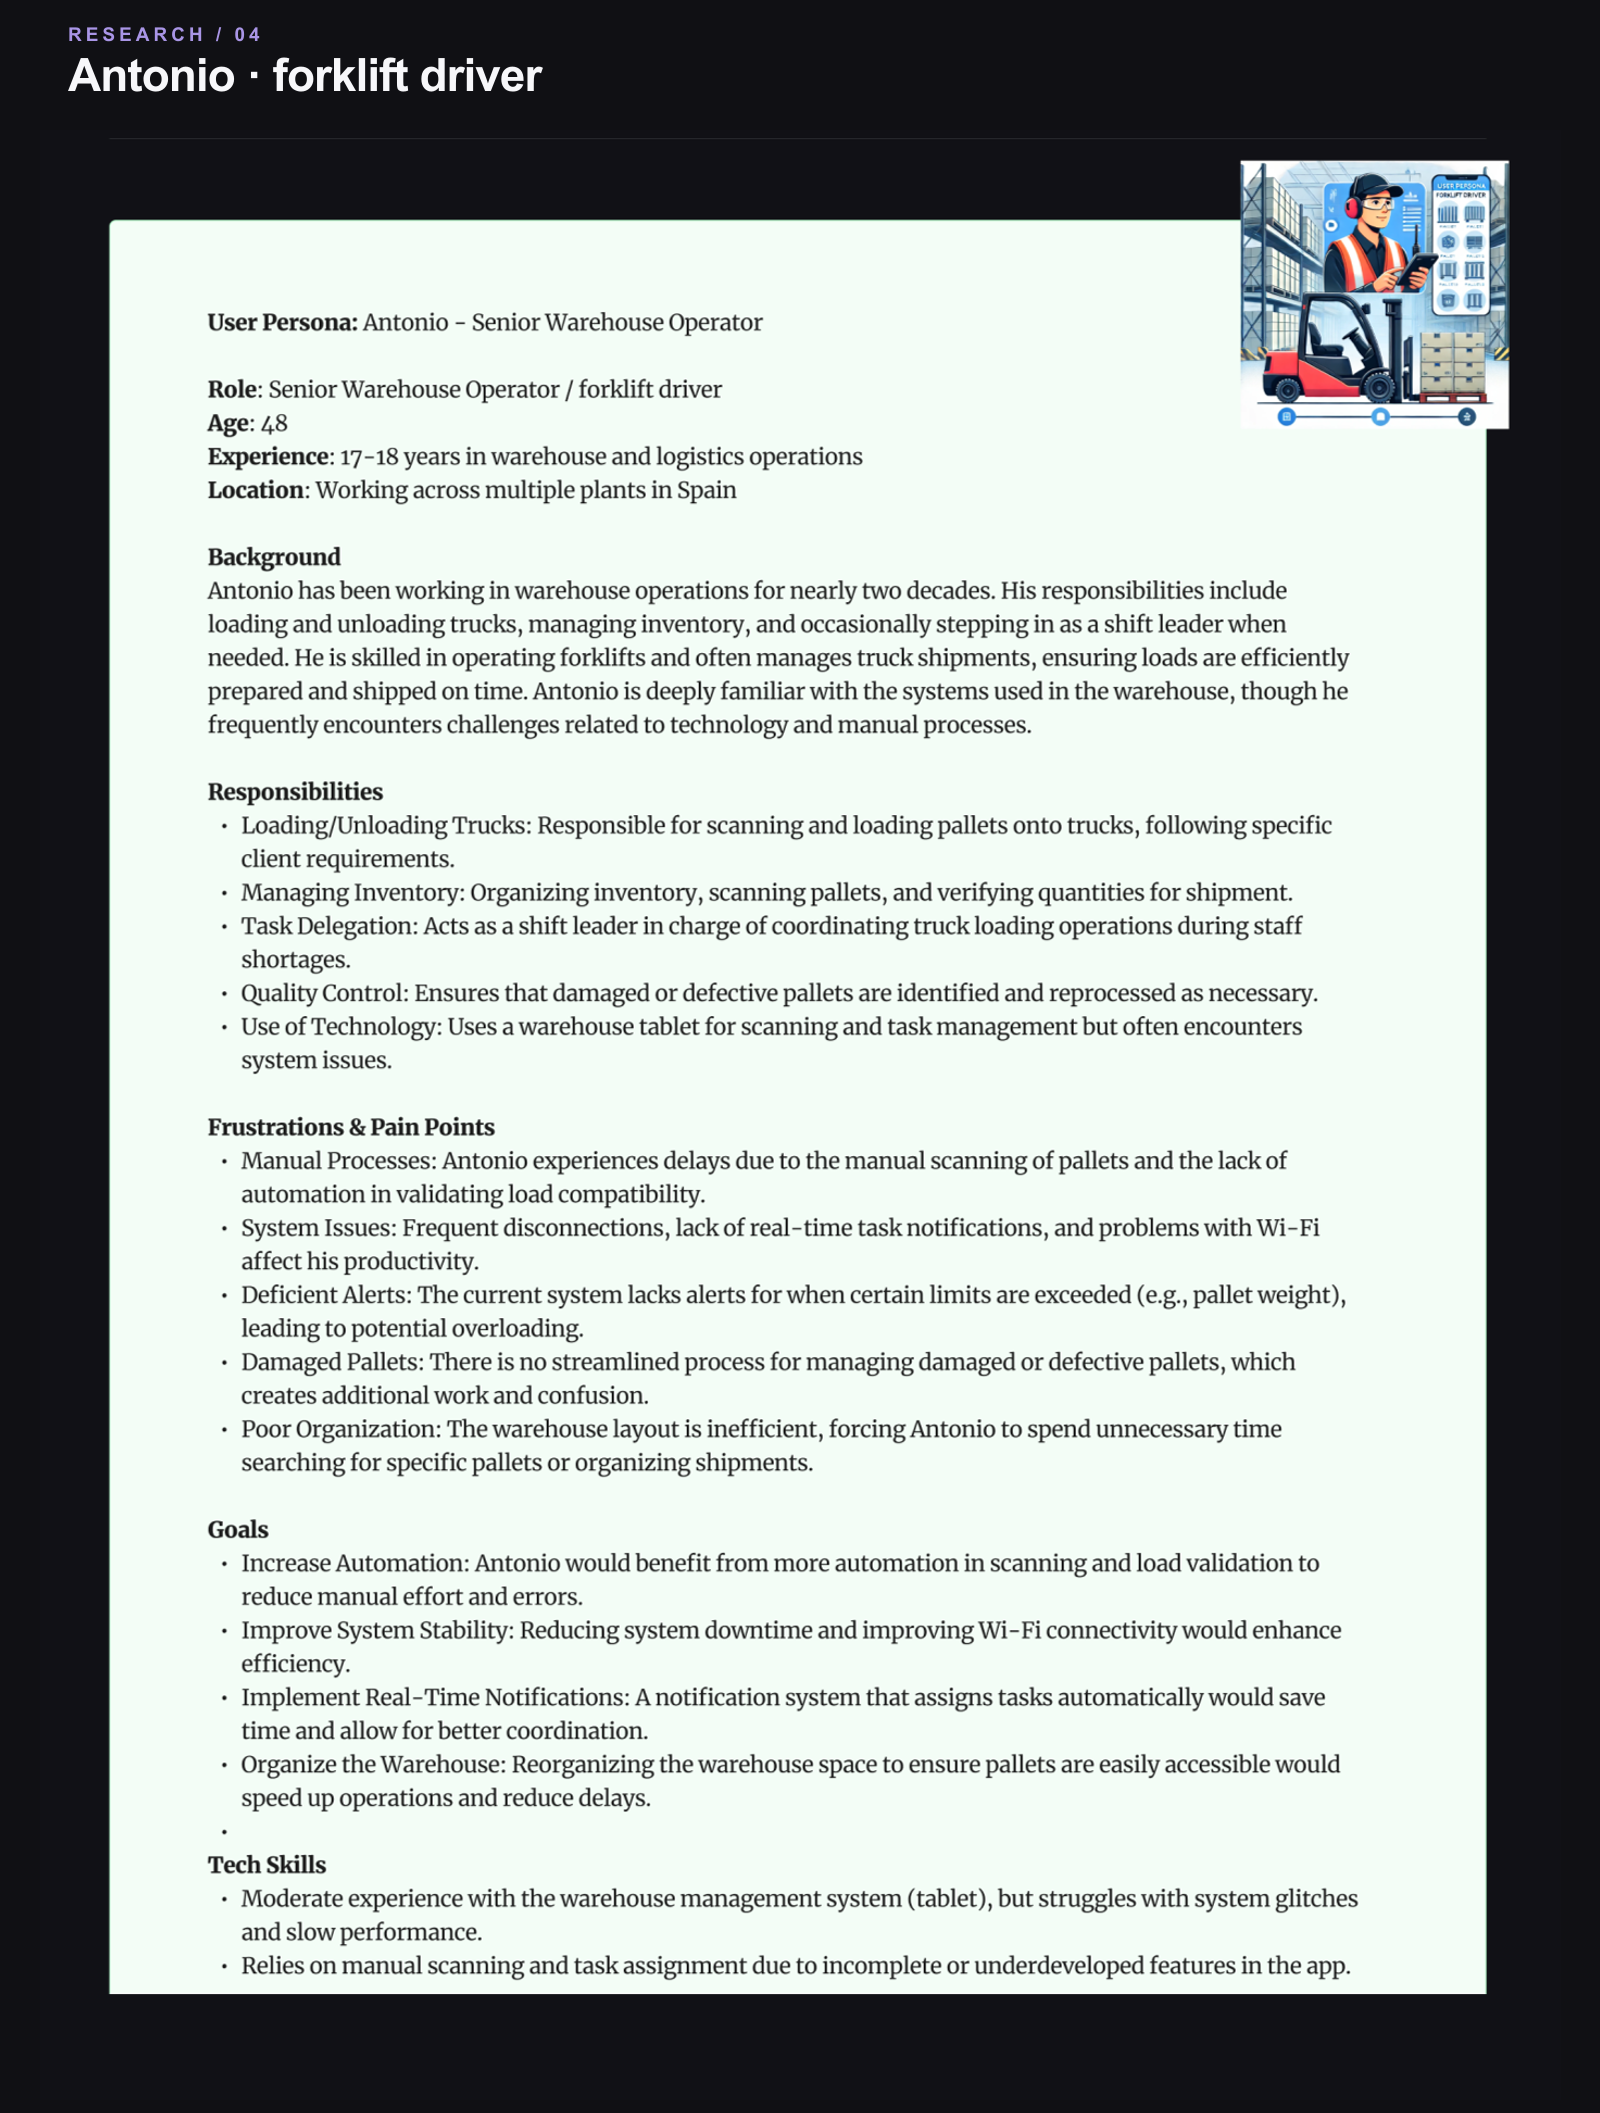
Interviews and fieldwork exposed three perspectives on the same operation: Antonio executes pallet movements, Fran plans loads and delegates work, and Oliver supports system adoption across plants.
These profiles became a way to check design decisions. The driver needs an unambiguous next action; the coordinator needs a current plan; the IT key user needs patterns that can work in more than one warehouse.
| Person #1 · Antonio — Forklift driver | |
|---|---|
| Portrait |

|
| Profile | Age 48 · Spain · 17–18 years in warehouse operations · forklift driver and occasional shift leader. |
| About | Antonio moves, scans and loads pallets against shipment requirements, checks quantities and flags damaged stock. He works from a forklift-mounted tablet but still depends on handheld scanning and close coordination with colleagues. |
| Goals |
|
| Frustrations |
|
| Typical scenarios |
|
| Working style | Practical and experienced. Antonio values speed and accuracy, but also clear communication when the warehouse is under pressure. |
| Design insight | Show the next action, scan confirmation and exception state clearly on the mounted tablet. Connectivity failures need an explicit state so a driver does not mistake an interrupted task for a completed one. |
| Person #2 · Fran — Logistics coordinator | |
|---|---|
| Portrait |

|
| Profile | Mid-30s · works across several plants in Spain · seven years in logistics and warehouse operations. |
| About | Fran plans loads and shipments, leads seven direct reports and coordinates with 20–30 transport providers daily. Work moves between the warehouse app, Excel and printed orders, especially when priorities change. |
| Goals |
|
| Frustrations |
|
| Typical scenarios |
|
| Working style | Collaborative and adaptable. Fran needs flexibility across plants but values clear shared information for the team and external carriers. |
| Design insight | Connect load planning to the driver's task queue. Fran needs to see assignments, capacity and shipment status in one place, then communicate changes without relying on another printed sheet. |
| Person #3 · Oliver — IT specialist and key user | |
|---|---|
| Portrait |

|
| Profile | Age 34 · based in Austria · ten years with the company, including several years supporting logistics-system rollouts across the DACH region. |
| About | Oliver tests WMS releases with developers, supports local ERP integration and trains logistics staff before and after rollout. He sees how a design behaves across desktop tools, tablets and different warehouse setups. |
| Goals |
|
| Frustrations |
|
| Typical scenarios |
|
| Working style | Technically confident and pragmatic. Oliver evaluates whether a solution can be adopted and supported across sites, not just whether it works in a single demo. |
| Design insight | Keep core interactions consistent while allowing for different warehouse layouts and processes. Tablet controls and system states must remain legible in working conditions, including when operators wear gloves. |
04 · Product direction
From evidence to a shared plan
The interviews changed the conversation from requested features to the work each role needed to complete.
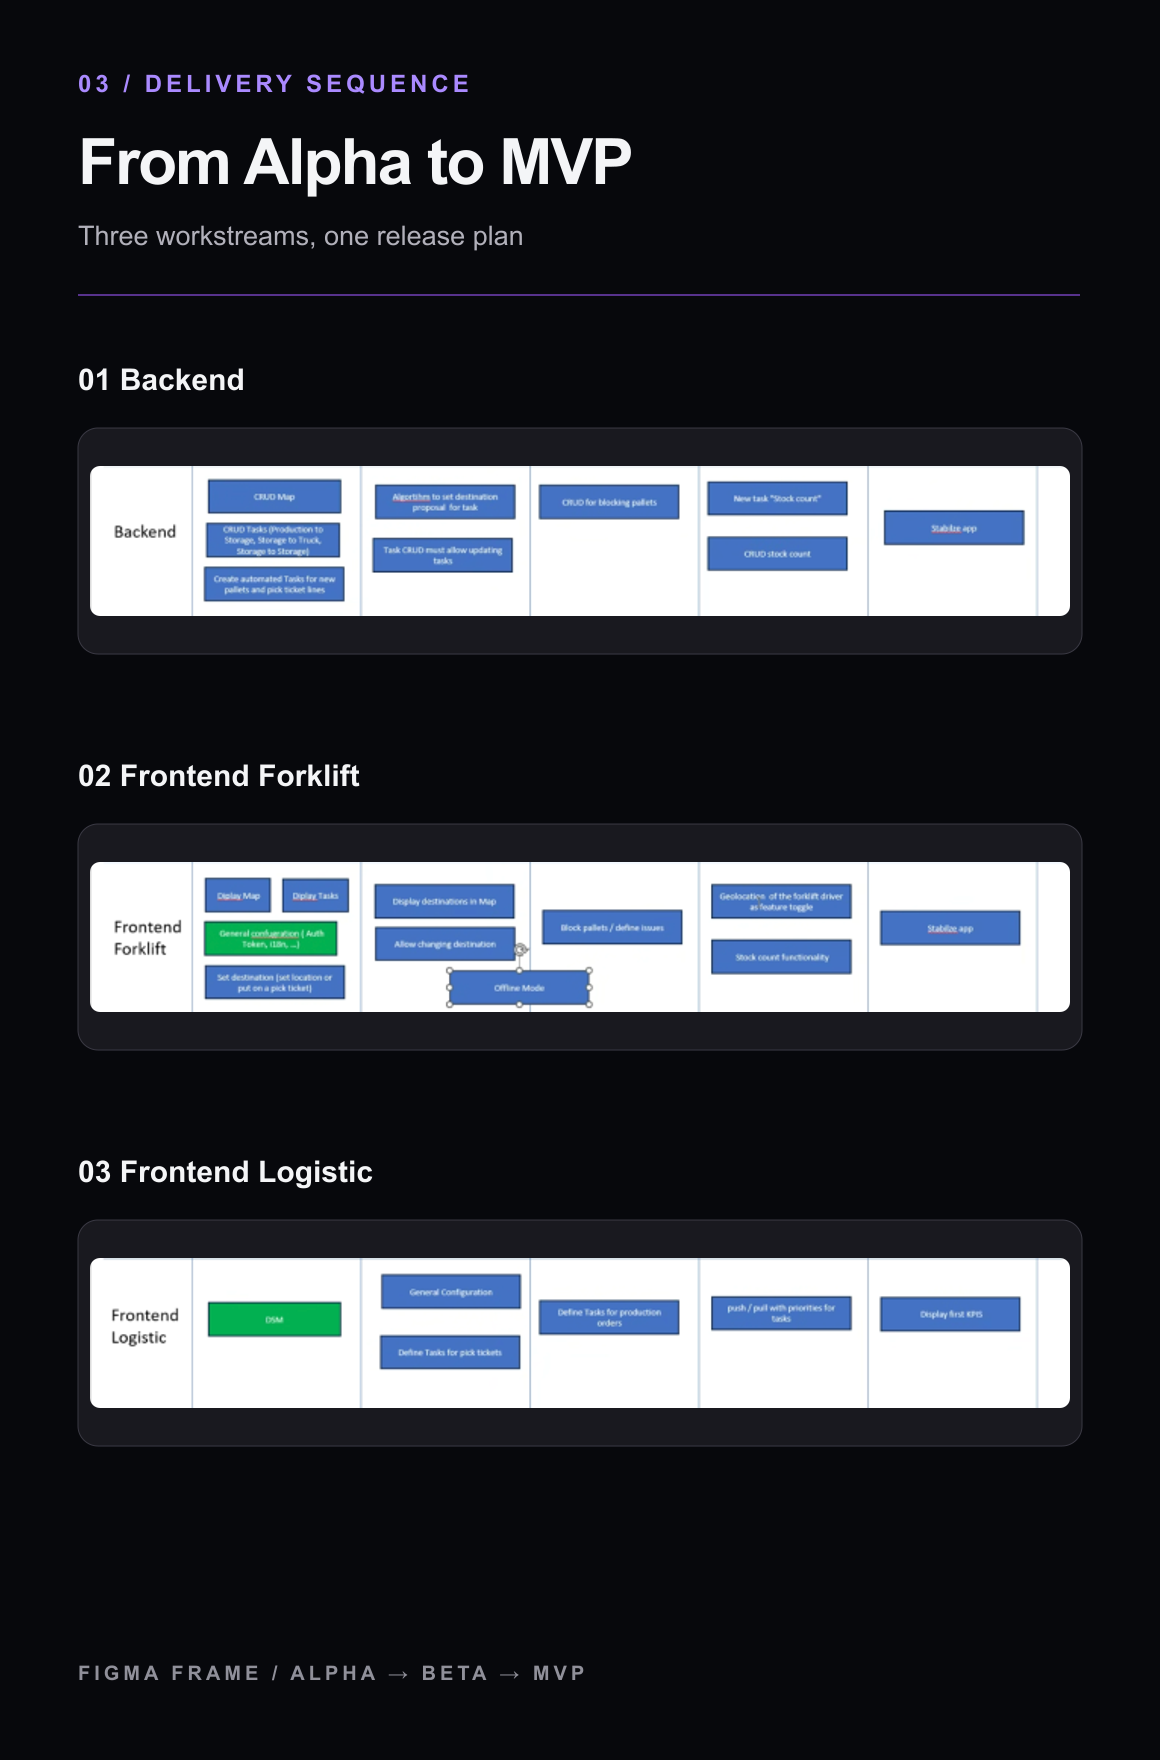
I mapped the findings against company objectives and discussed scope and feasibility with product owners and engineering. We prioritised task assignment, pallet visibility and shipment planning rather than make every tracking and automation idea a prerequisite for the MVP. This narrowed the first delivery, but left some manual work in place. The feature map and multi-quarter roadmap separated immediate workflow improvements from technologies requiring further assessment.
- Translate warehouse findings into objectives and explicit product decisions.
- Prioritise the workflows that drivers and coordinators depend on each shift.
- Separate MVP scope from ideas needing further validation or technical work.
- Sequence releases against a longer-term roadmap shared with stakeholders.
Prioritise operational clarity
Give the coordinator a way to assign and revise work, and give the driver a clear task and pallet destination.
Sequence the ambition
Discuss tracking and automation with engineering without presenting unvalidated technologies as part of the first release.
Keep delivery moving
Use milestones and reviewed workflows to align product decisions with the eight developers building the new system.
05 · Wireframes
MVP wireframes
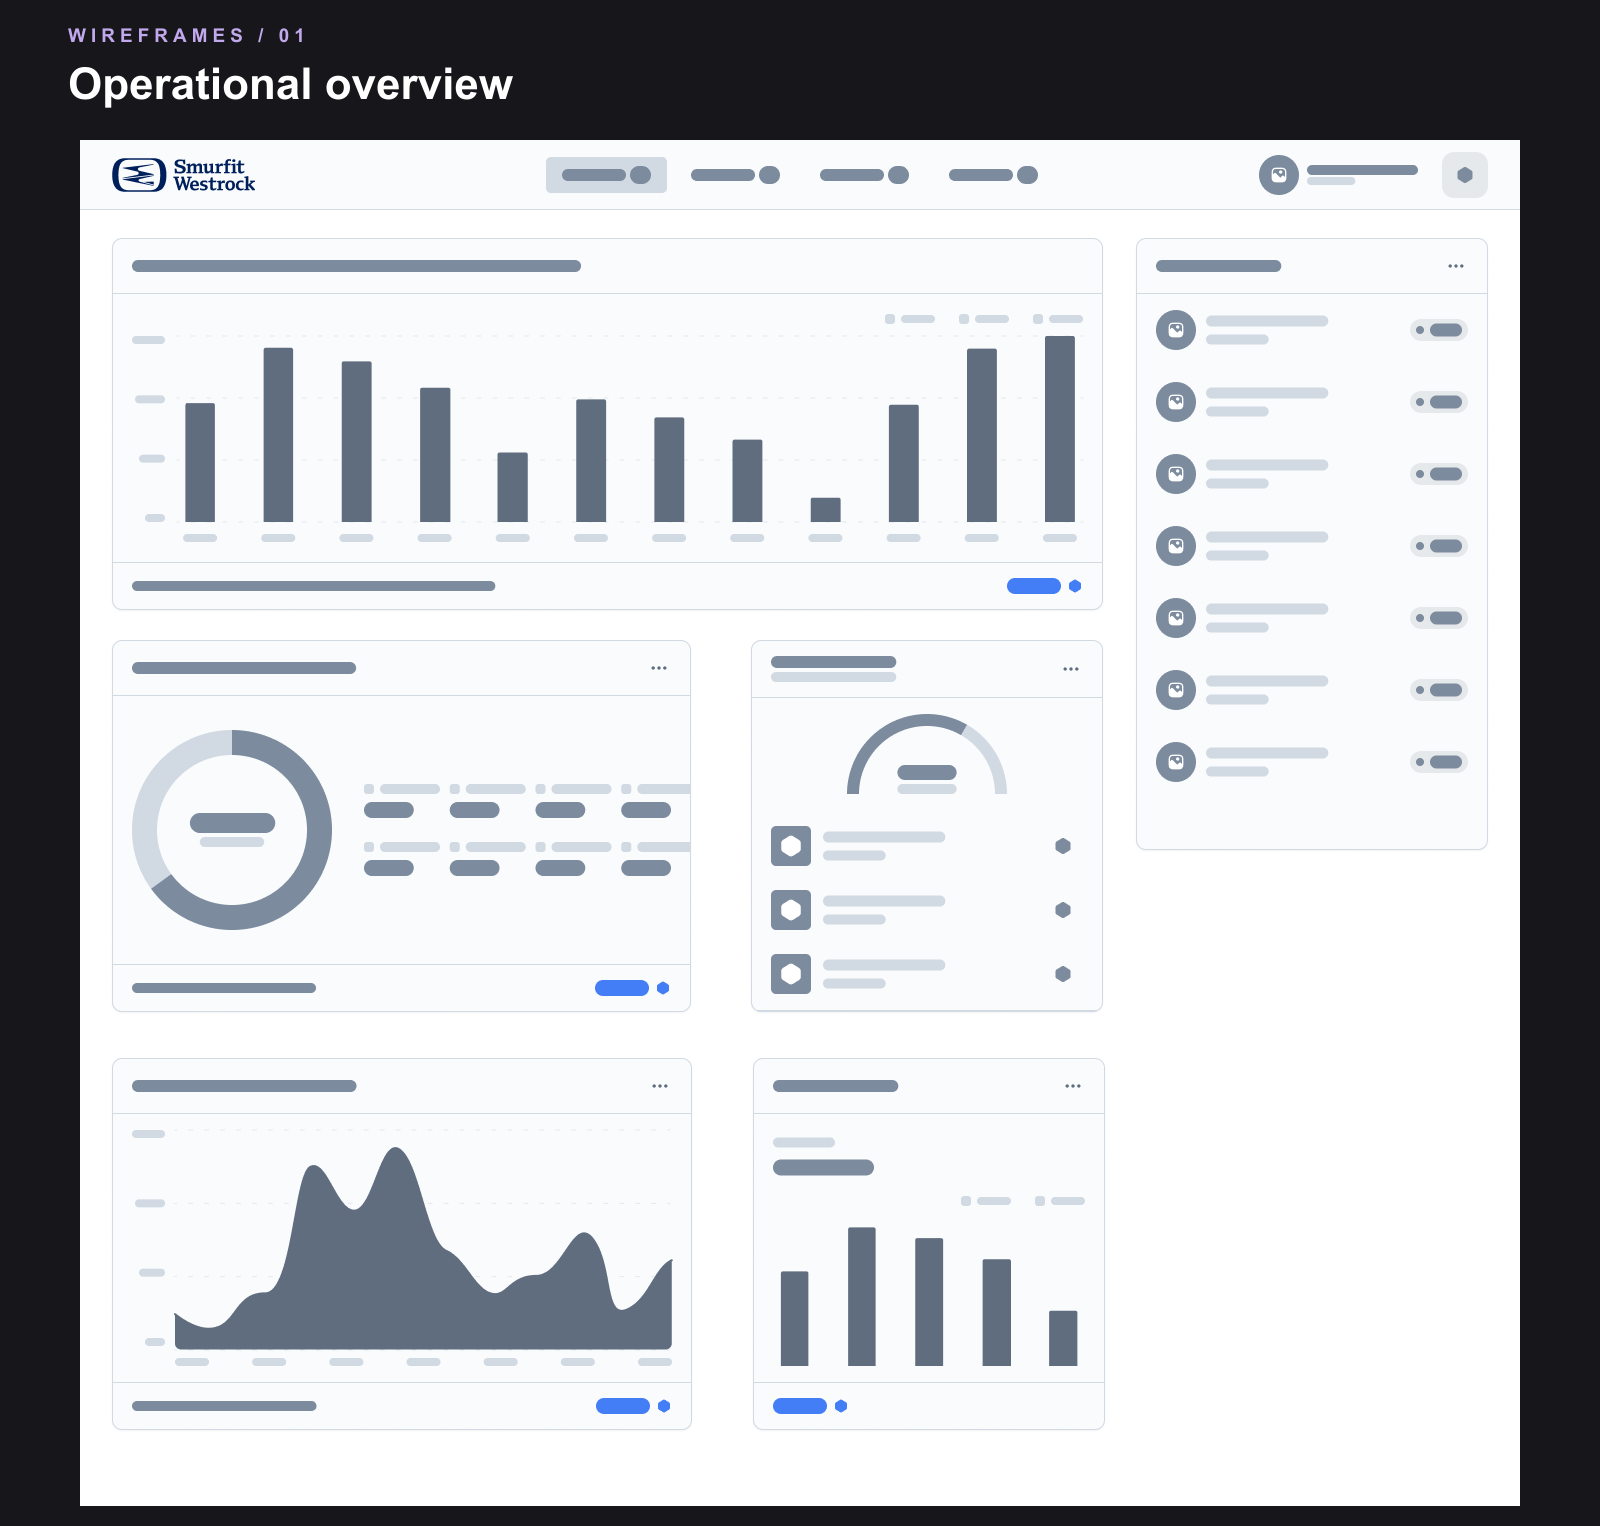
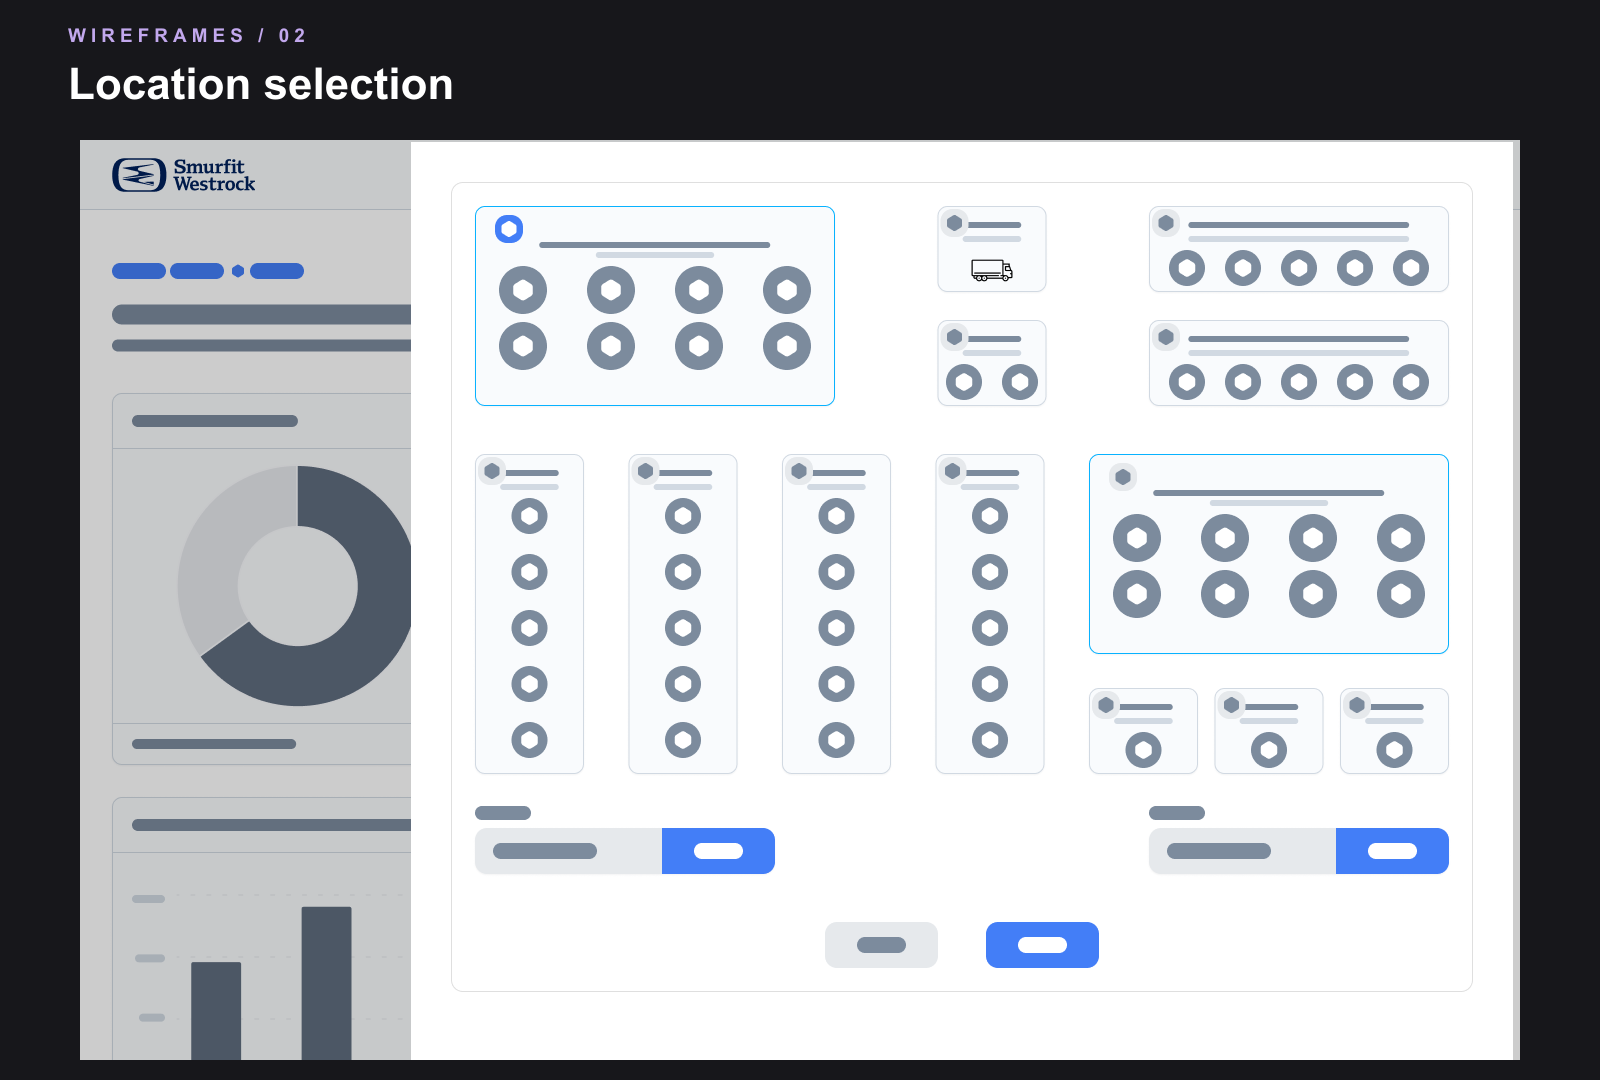
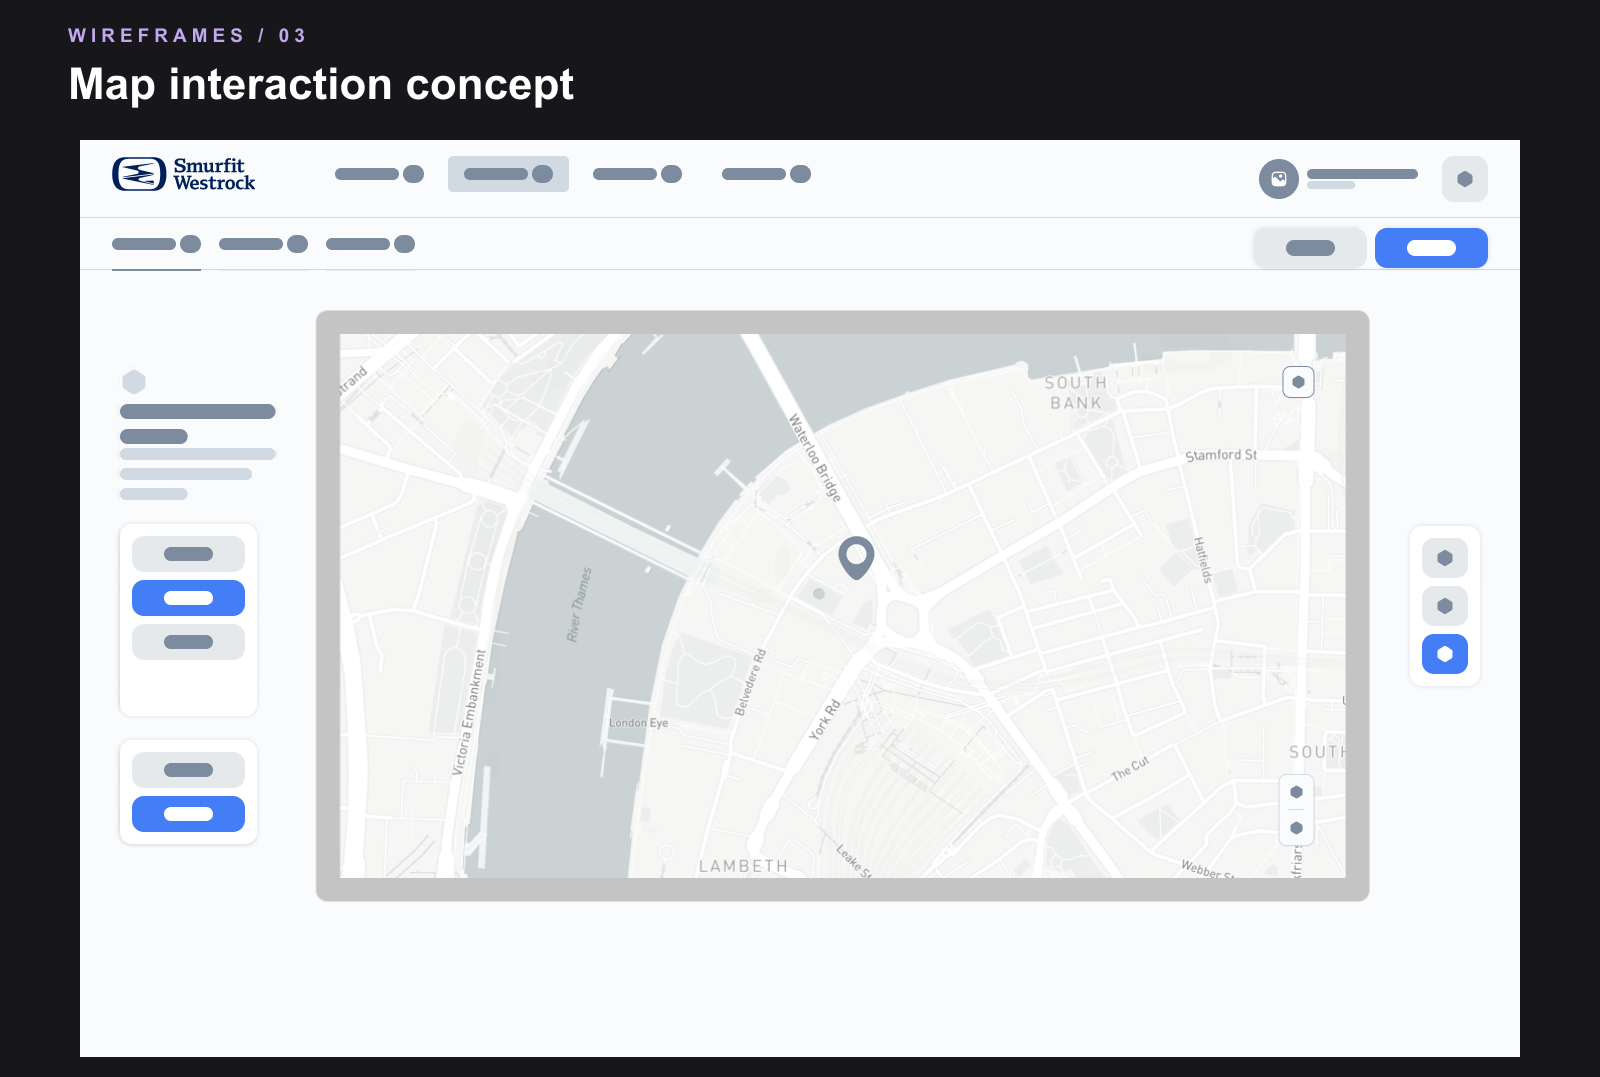
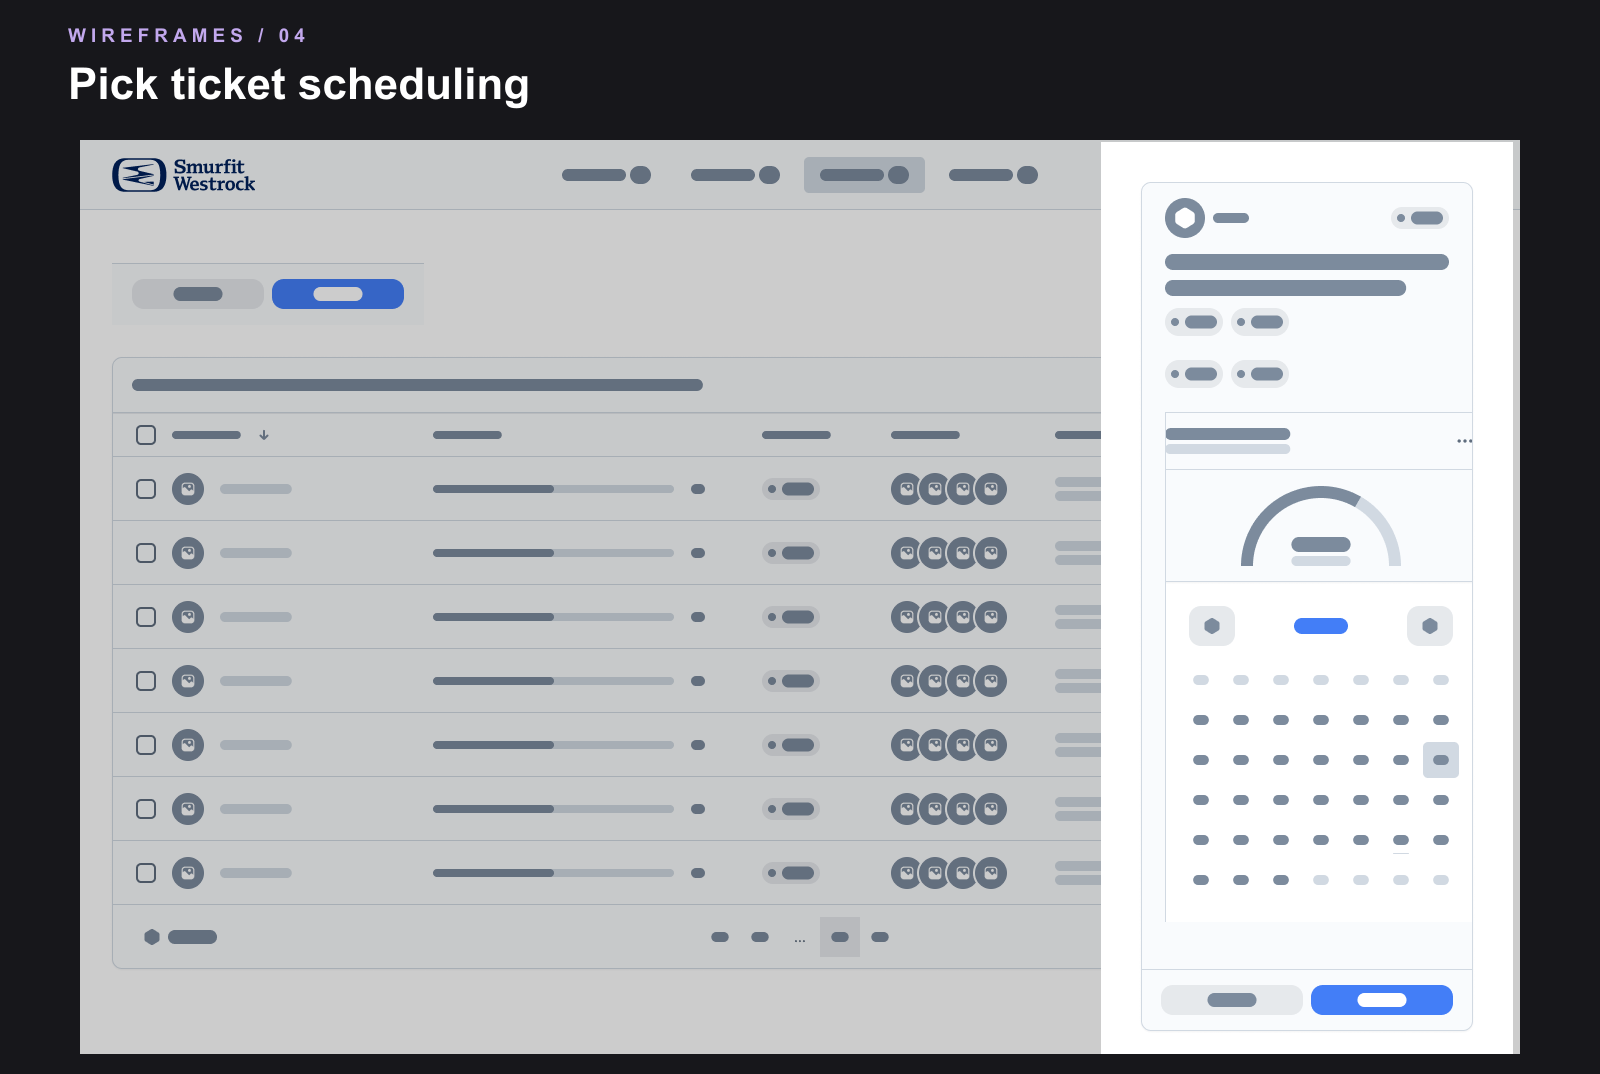
I used low-fidelity wireframes to resolve the workflow before visual detail. With product owners, I traced the hand-off from a coordinator assigning work to a driver receiving a task, scanning a pallet, choosing its destination and confirming a movement or load. We also considered changed priorities and cases where the expected action could not be completed. Reviews with product and engineering helped settle what each role should see, decide and record.
- Separate the coordinator's planning view from the driver's tablet workflow.
- Make the pallet, destination and confirmation visible at each step.
- Include manual moves and exceptions when the planned route does not fit reality.
- Review task logic with product and engineering before high-fidelity design.
06 · Design System
A shared foundation, built in parallel
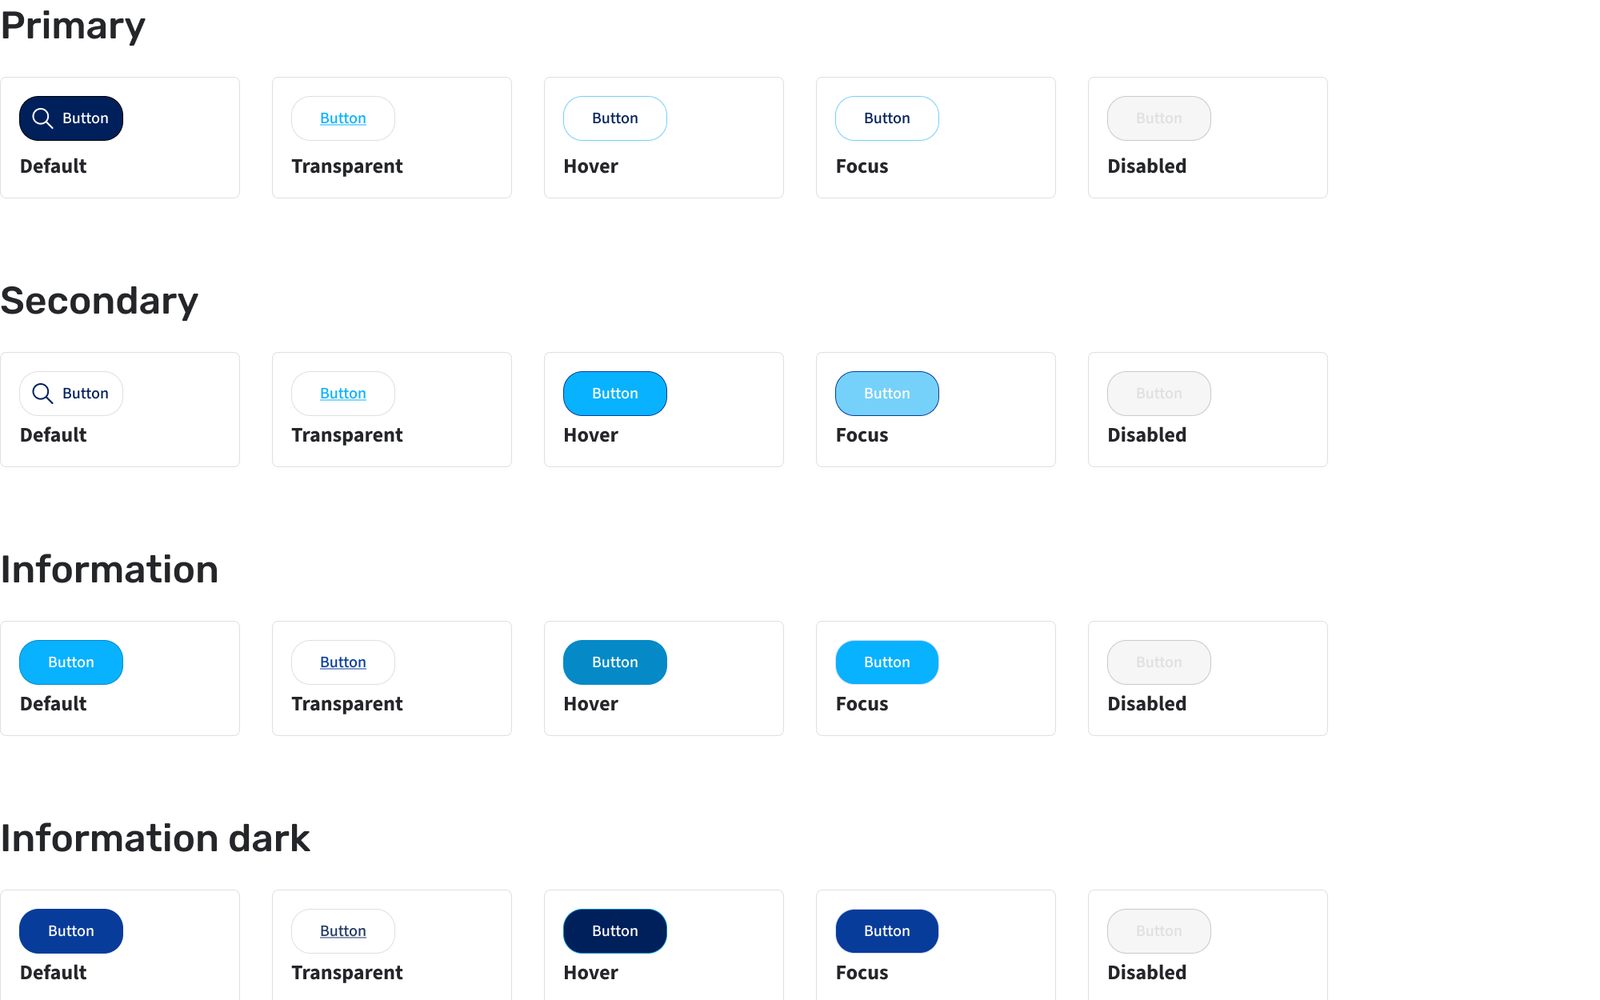
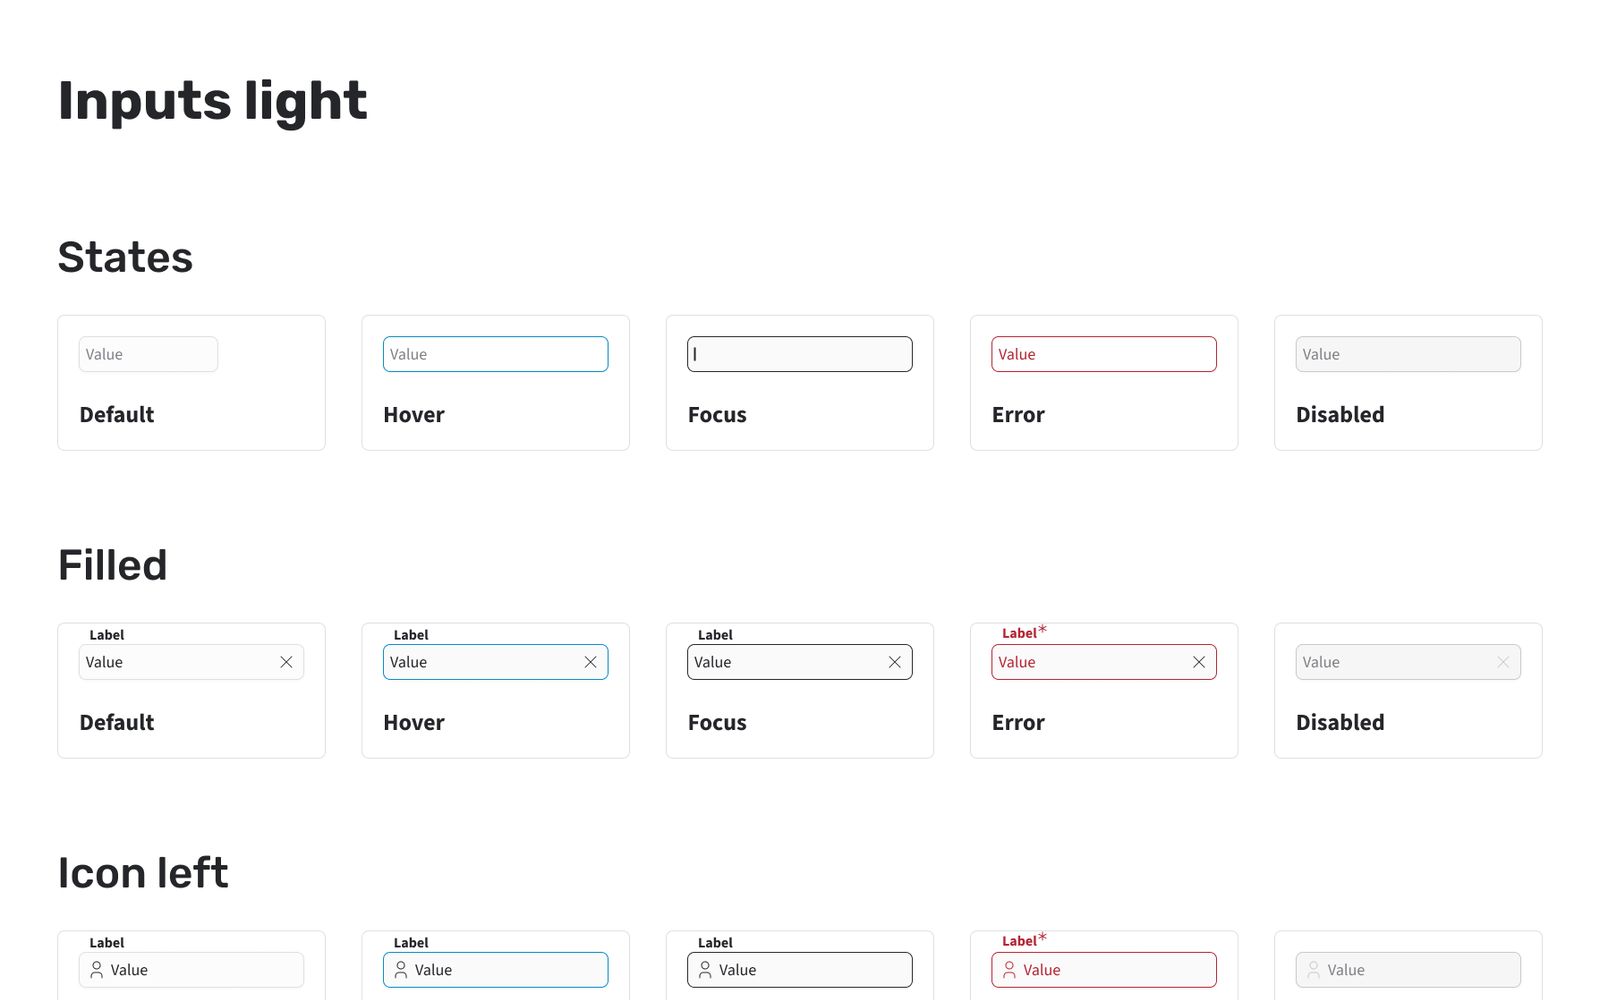
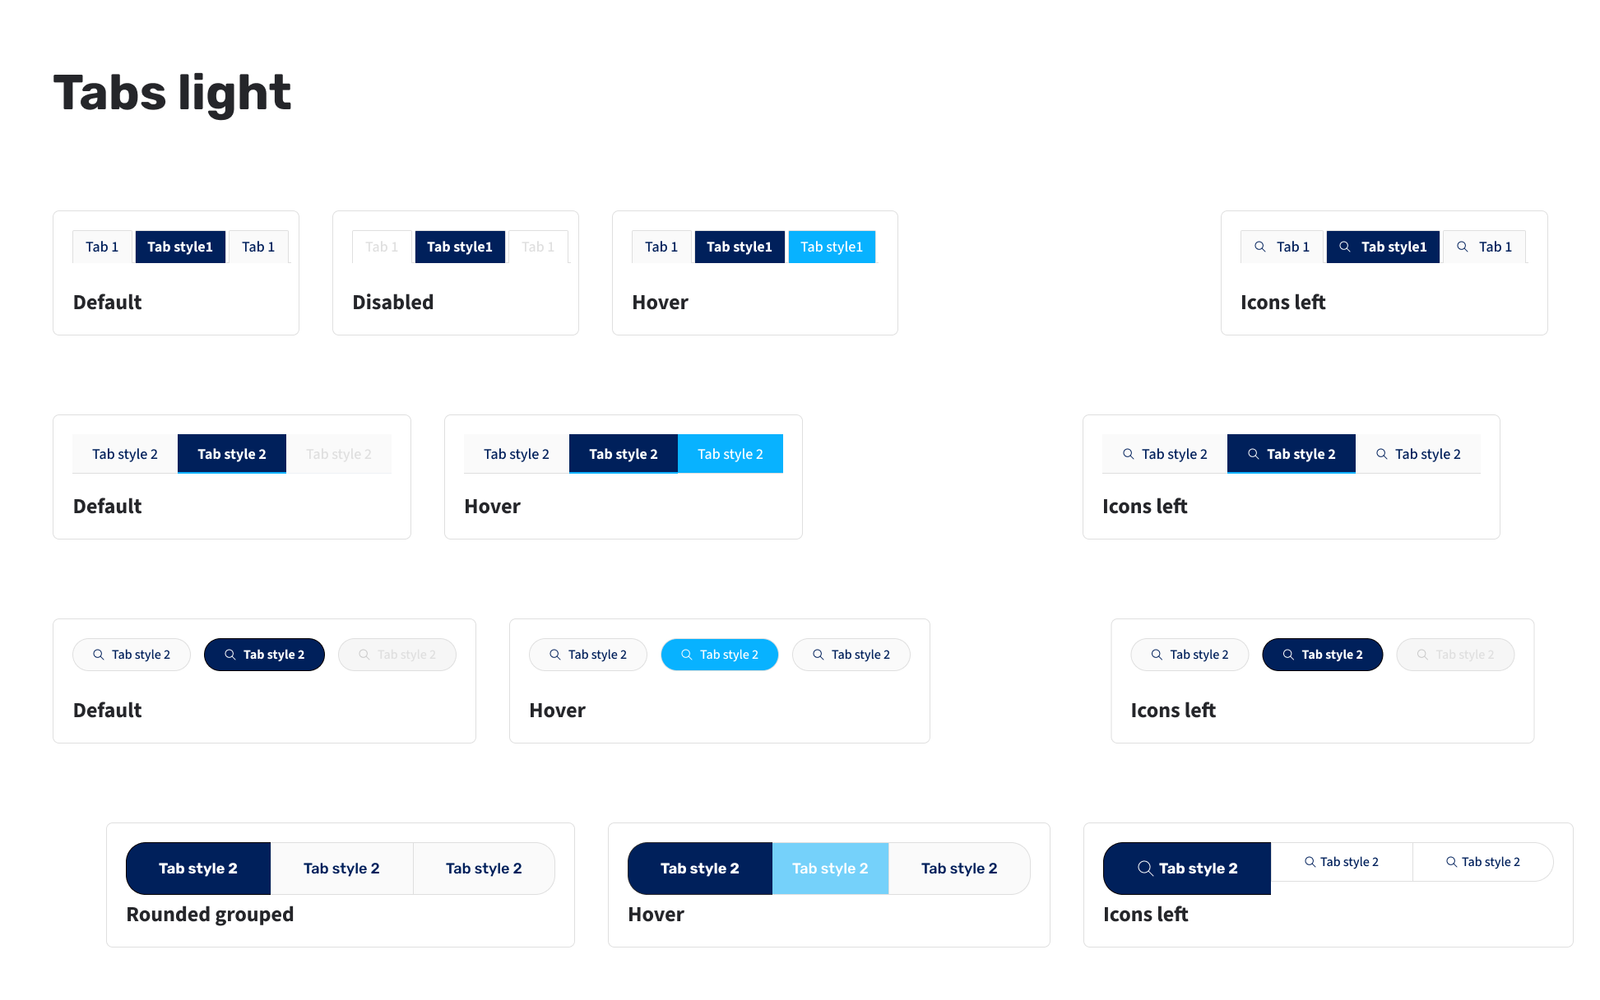
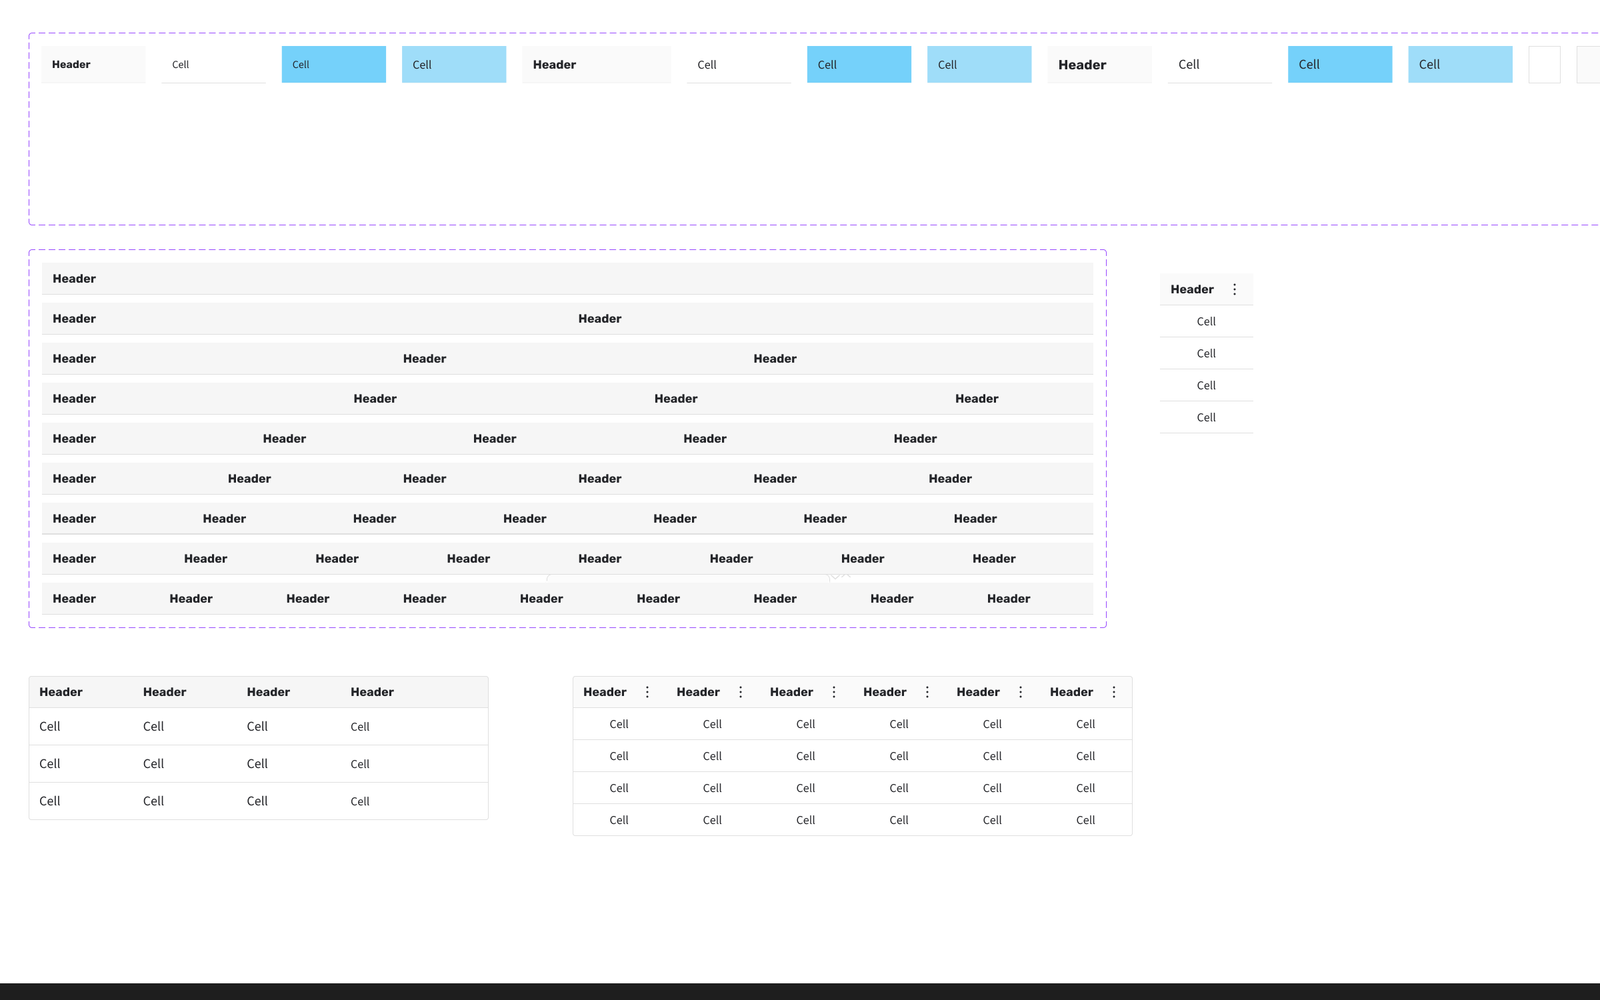
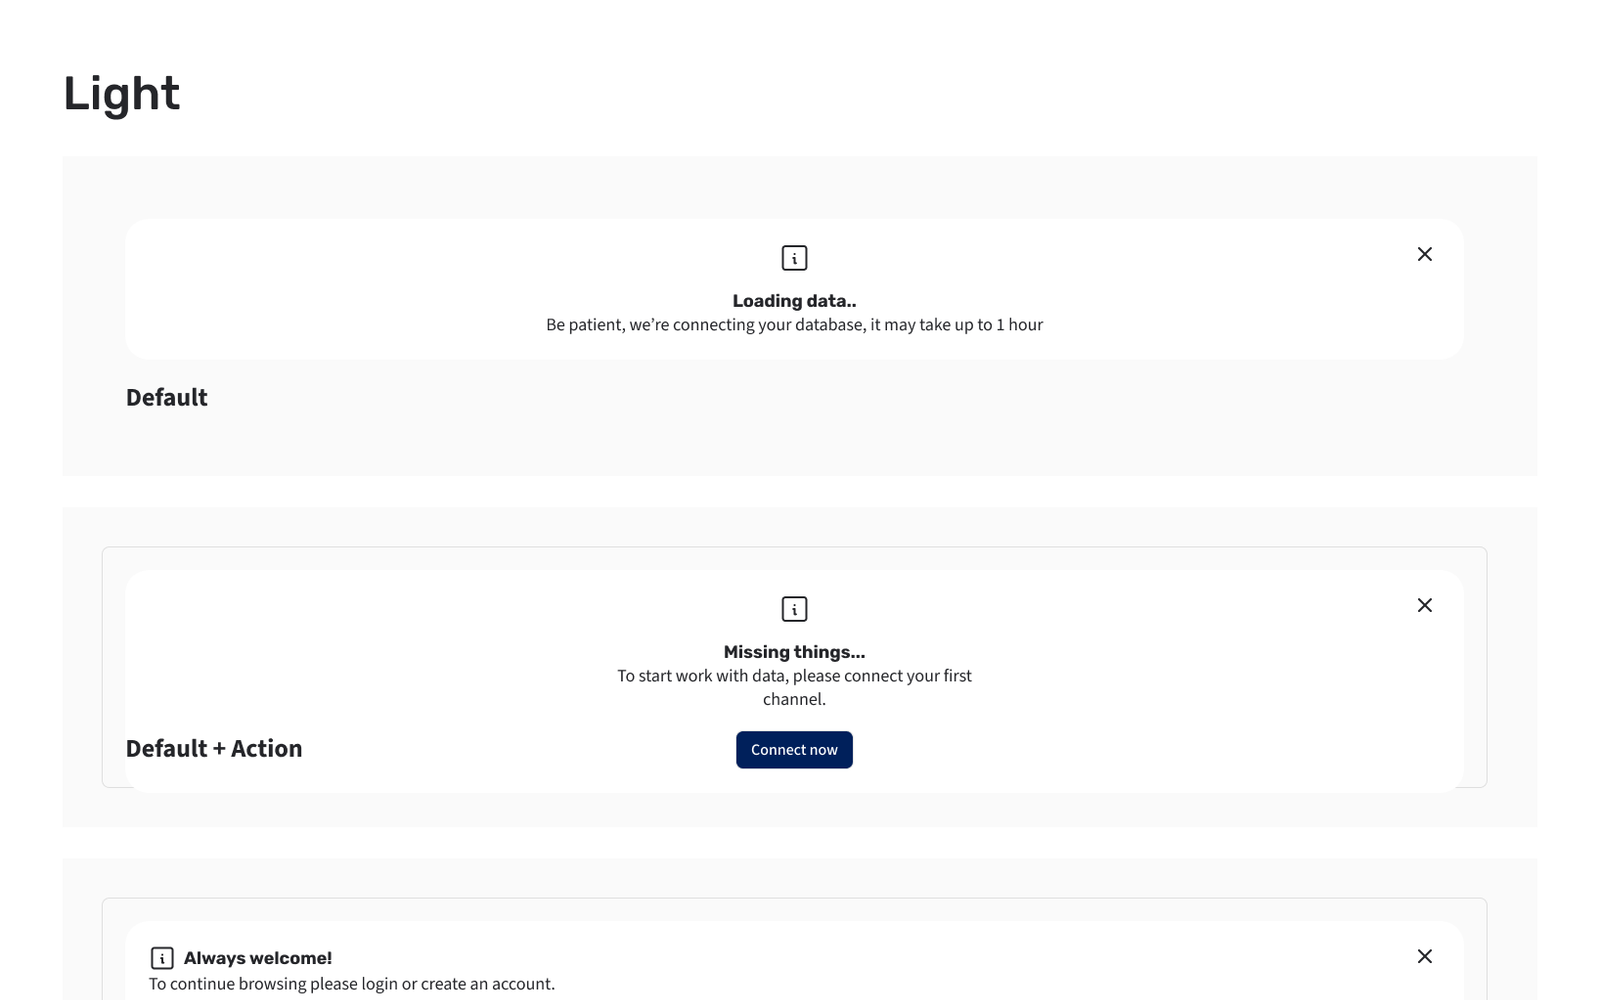
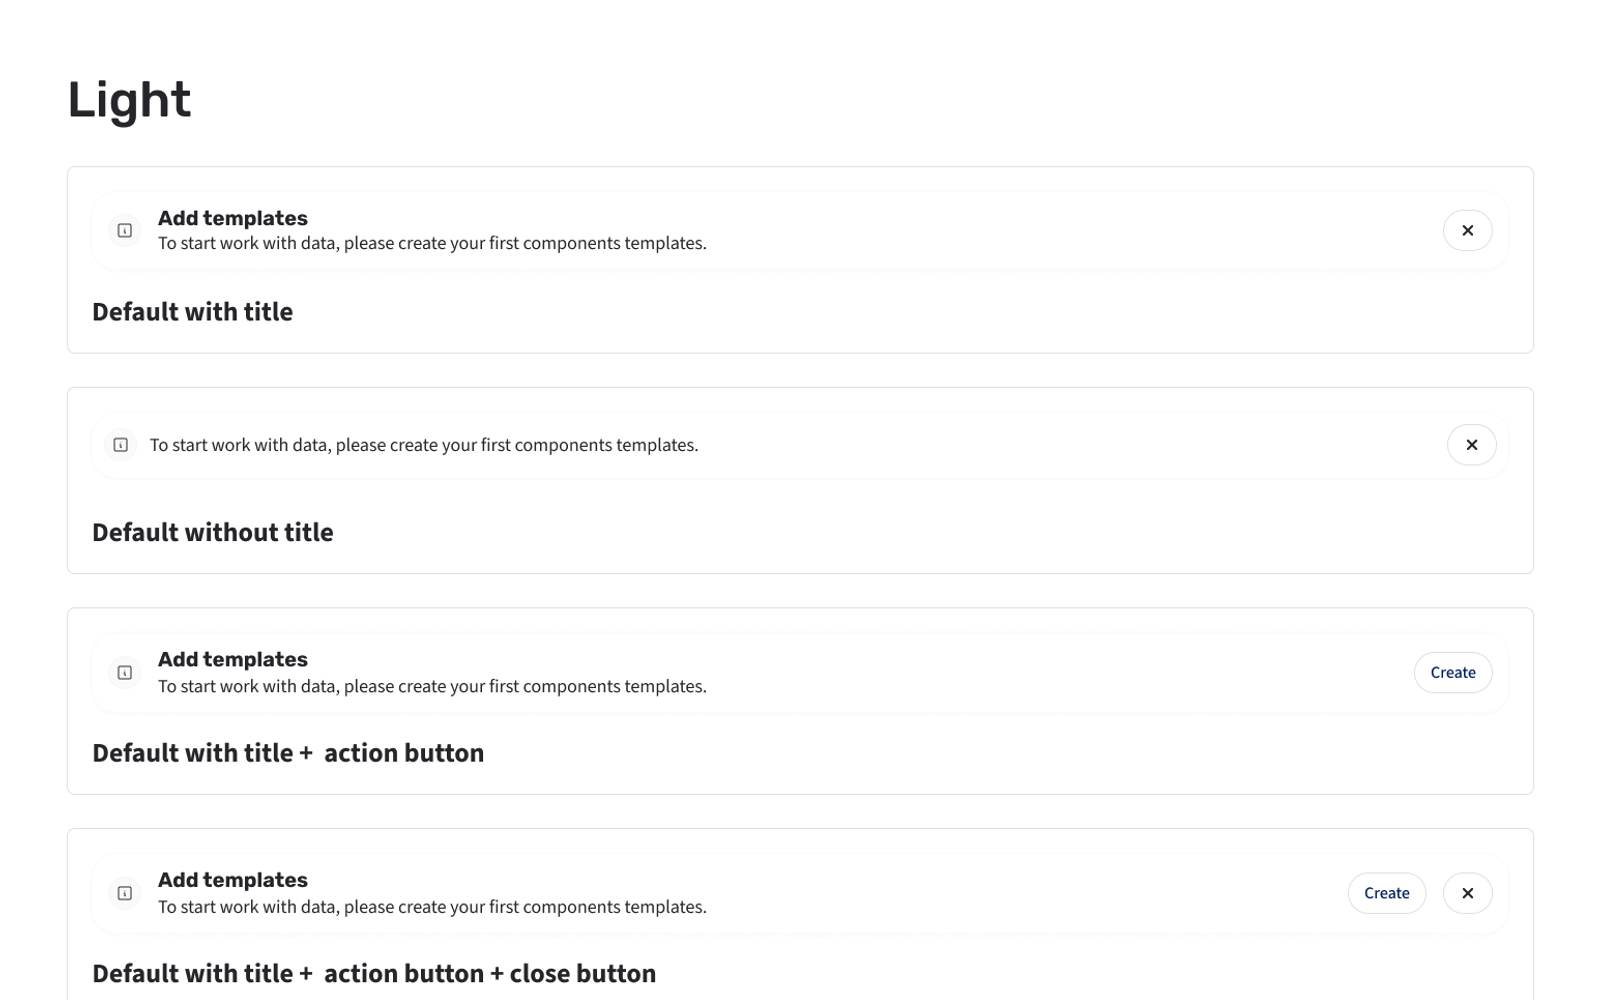
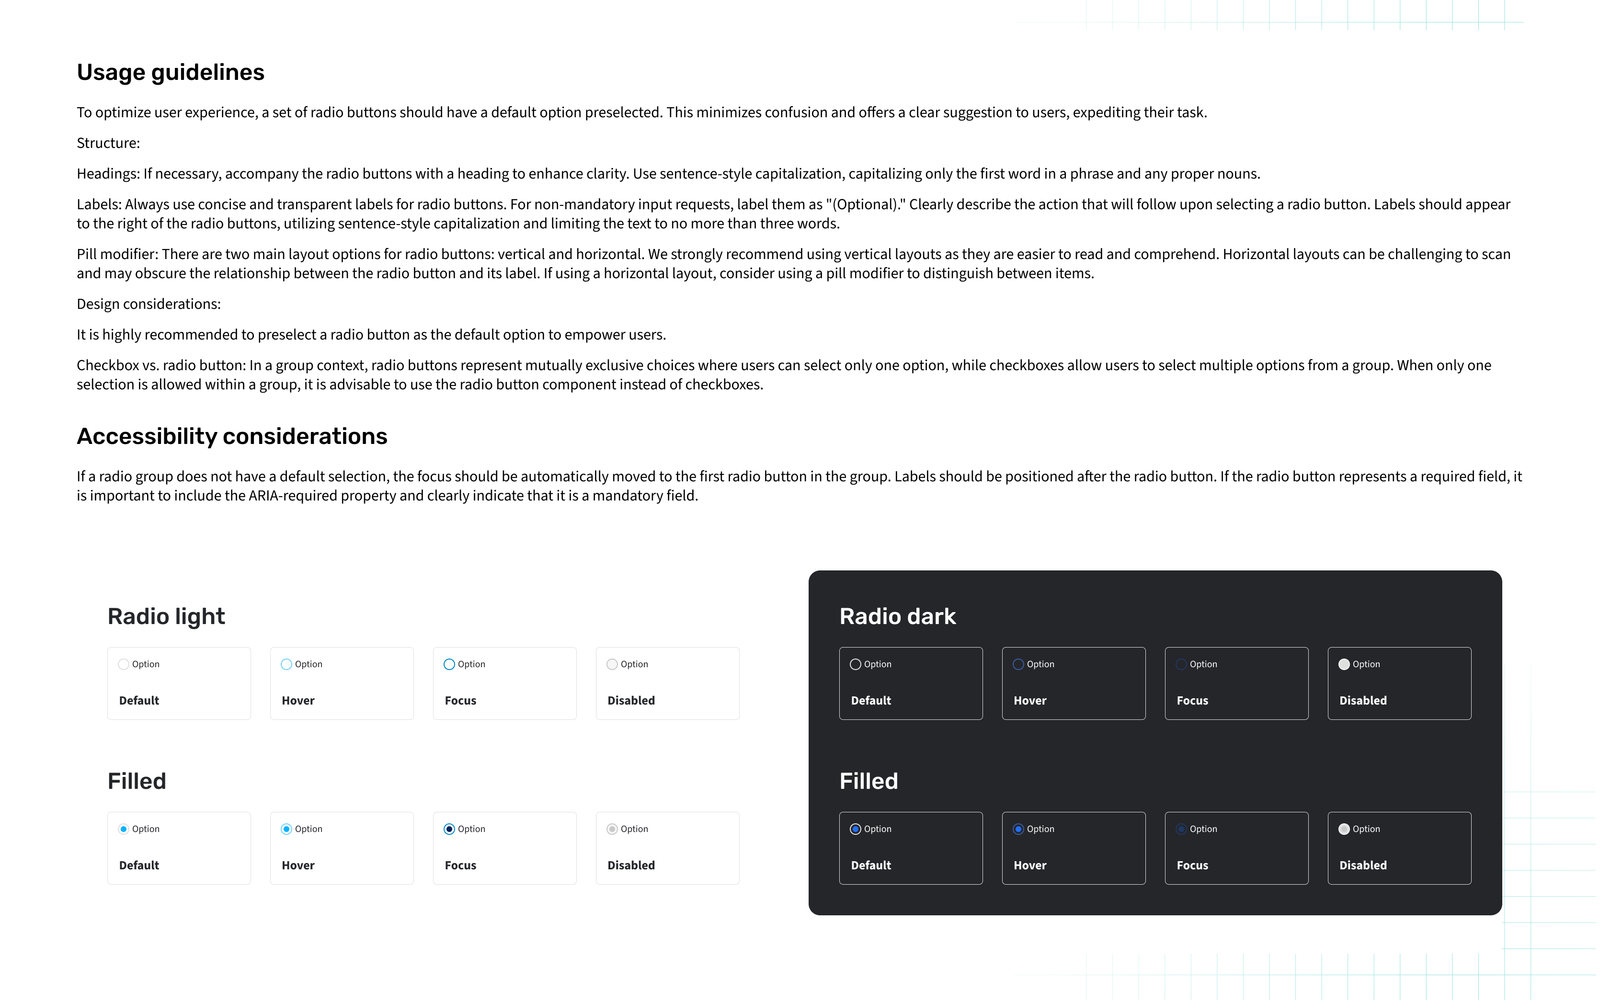
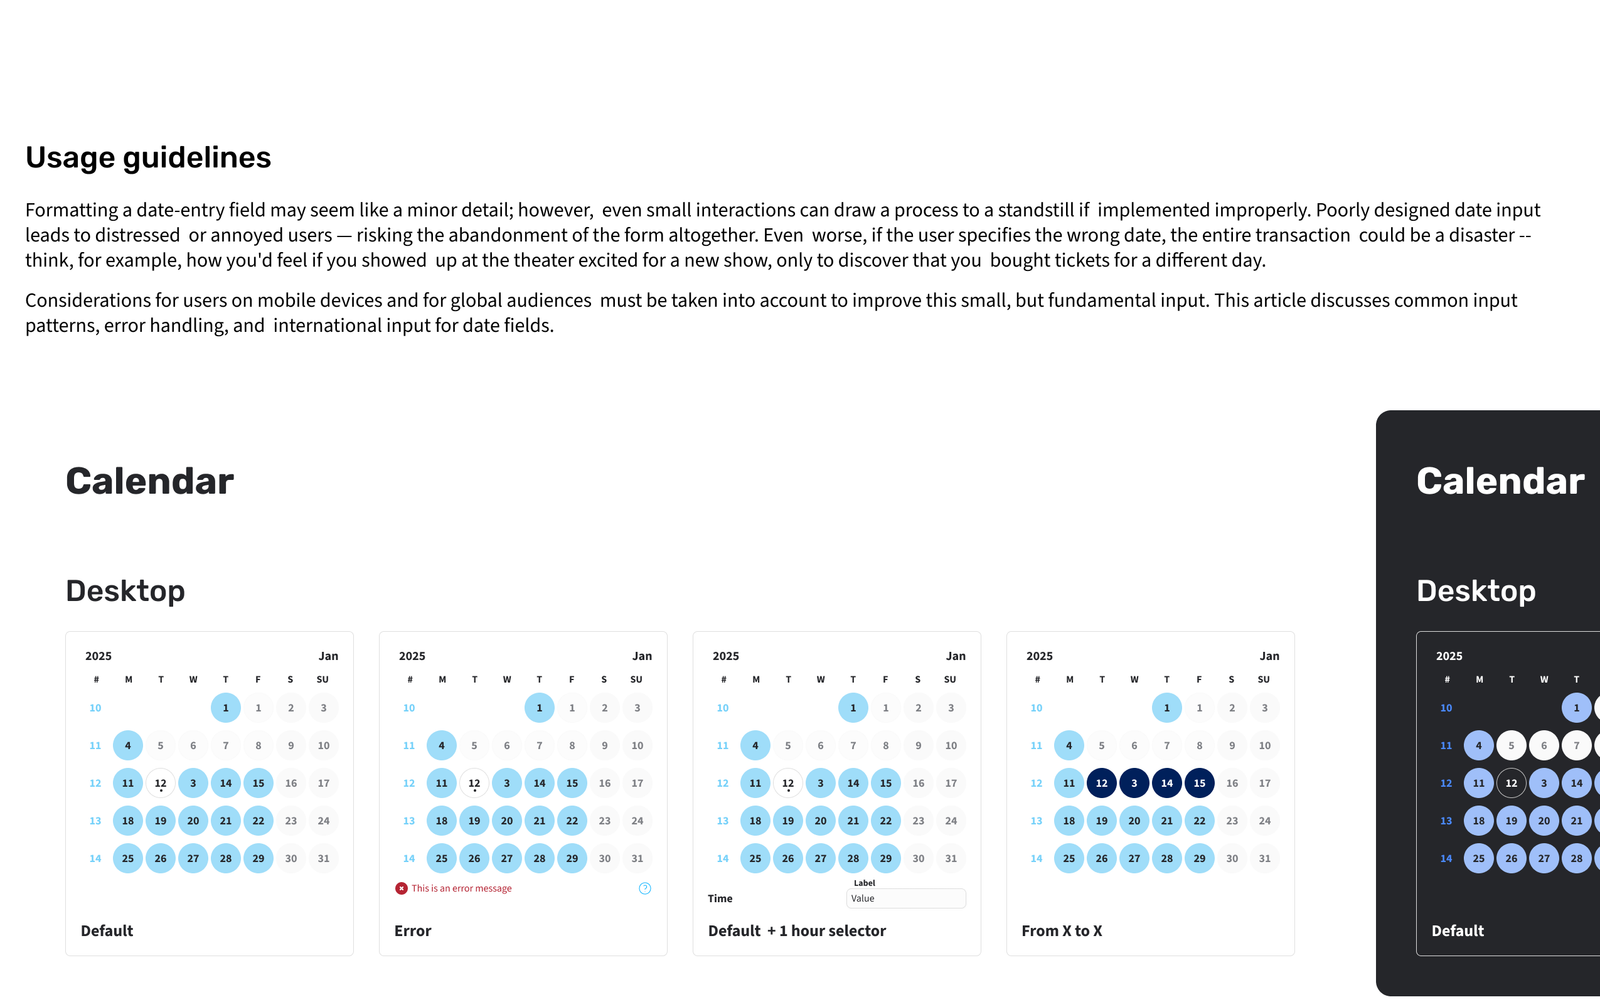
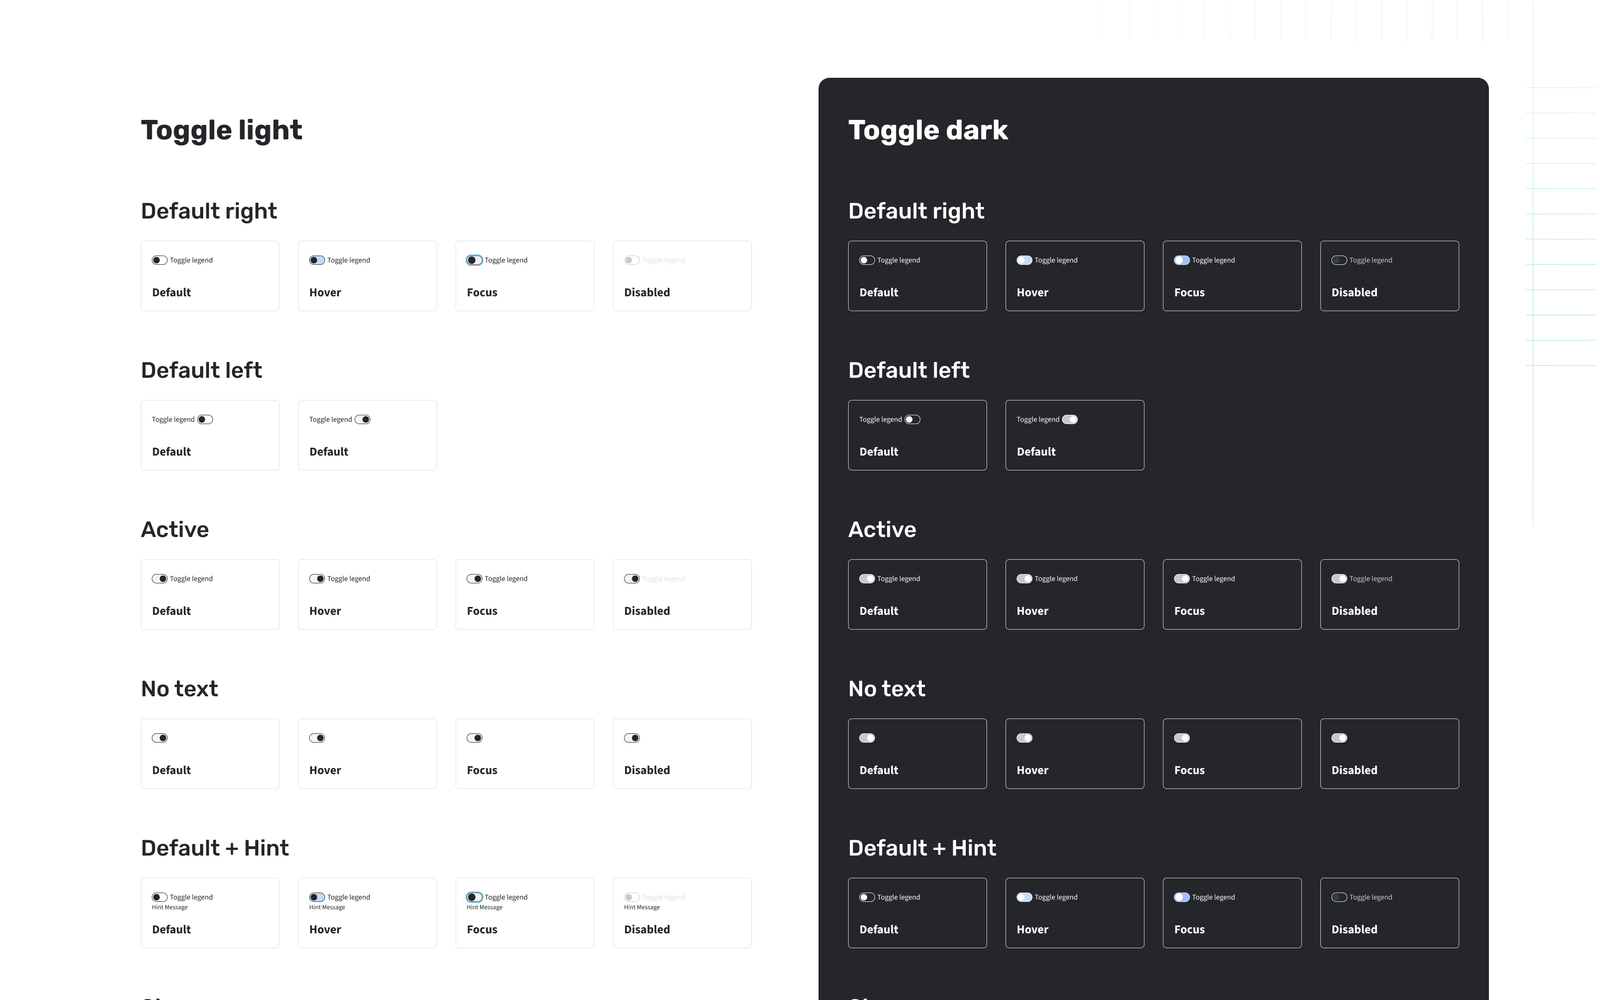
Wireframing and the Design System moved in parallel. Each week I handed developers a small, usable set of components, starting with controls such as buttons and form elements, so frontend work could progress while product decisions were still being reviewed. I defined shared patterns and colour variables in Figma, including light and dark themes for different warehouse conditions. MVP-only components stayed local to that product; the shared foundation could support later corporate applications. This cadence gave the team a common implementation reference without waiting for every screen to be finished.

07 · Warehouse MVP
Planning and execution, connected
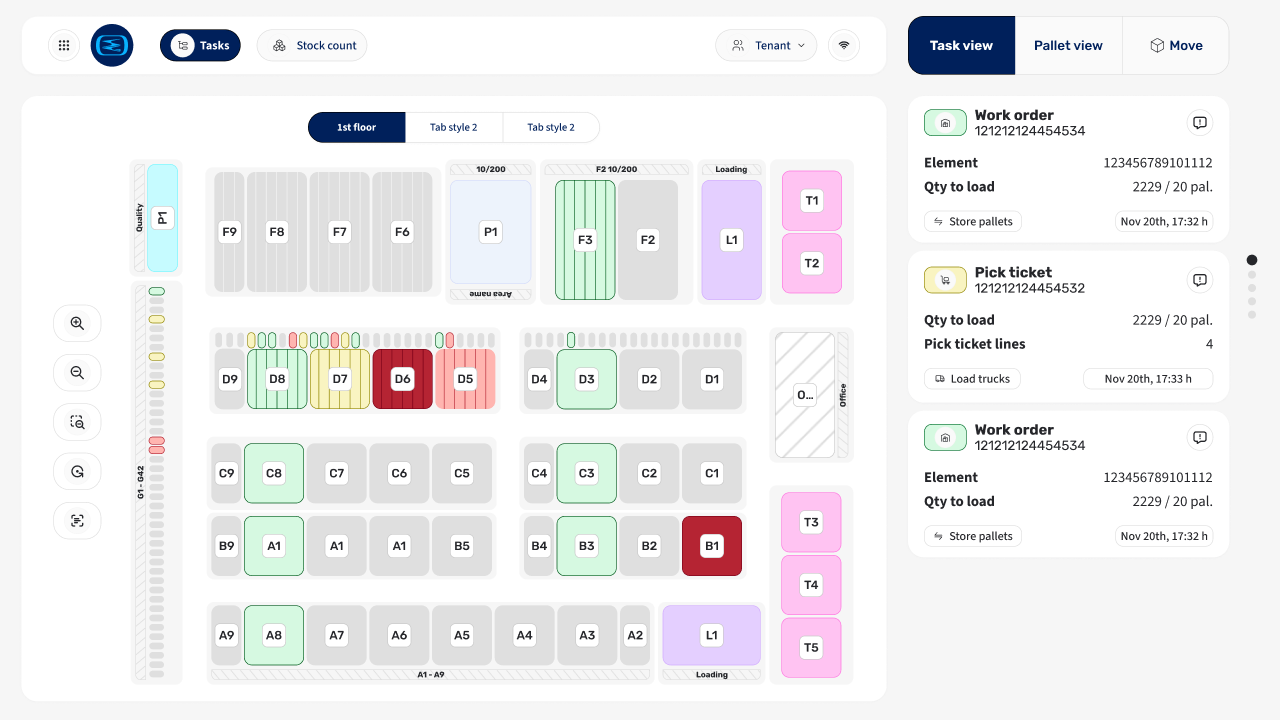
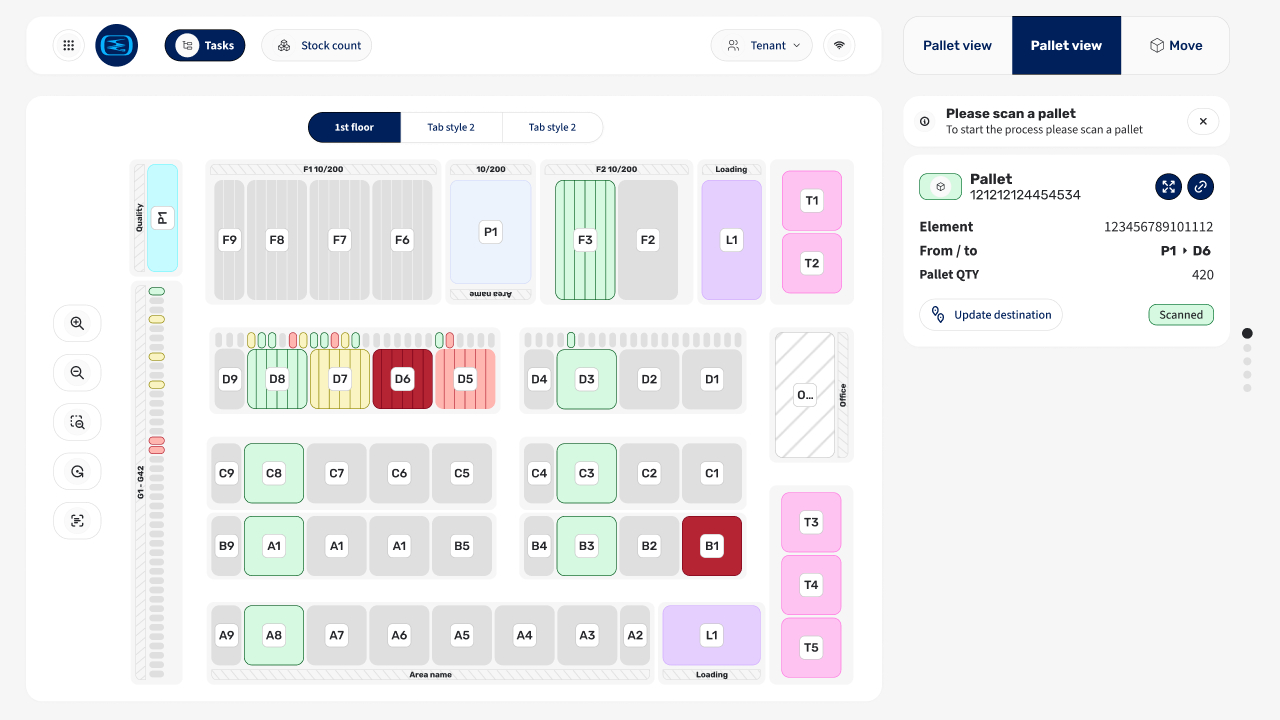
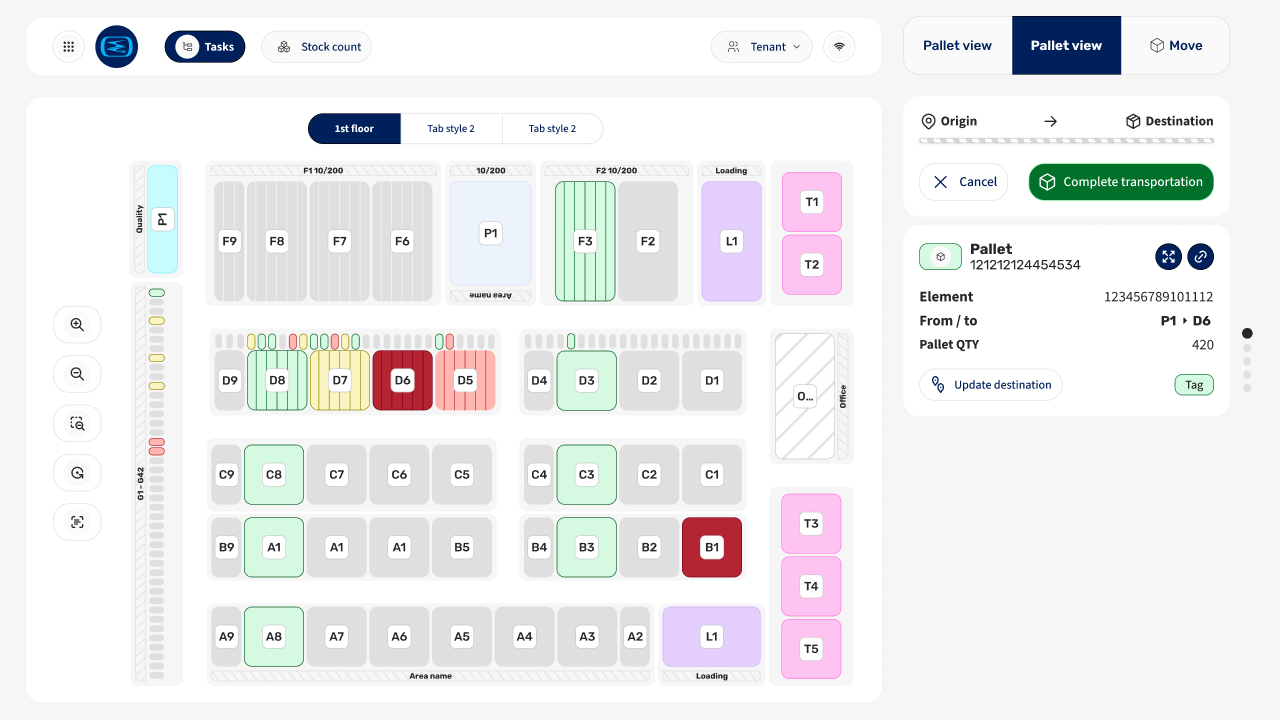
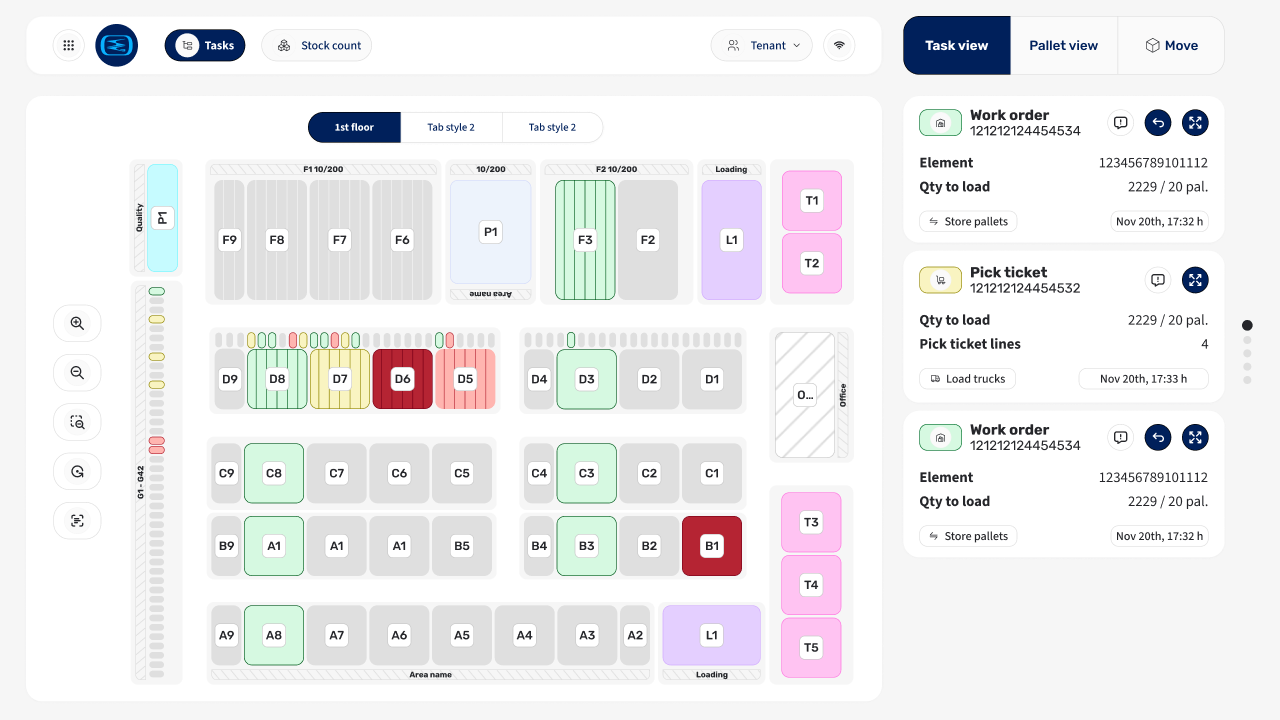
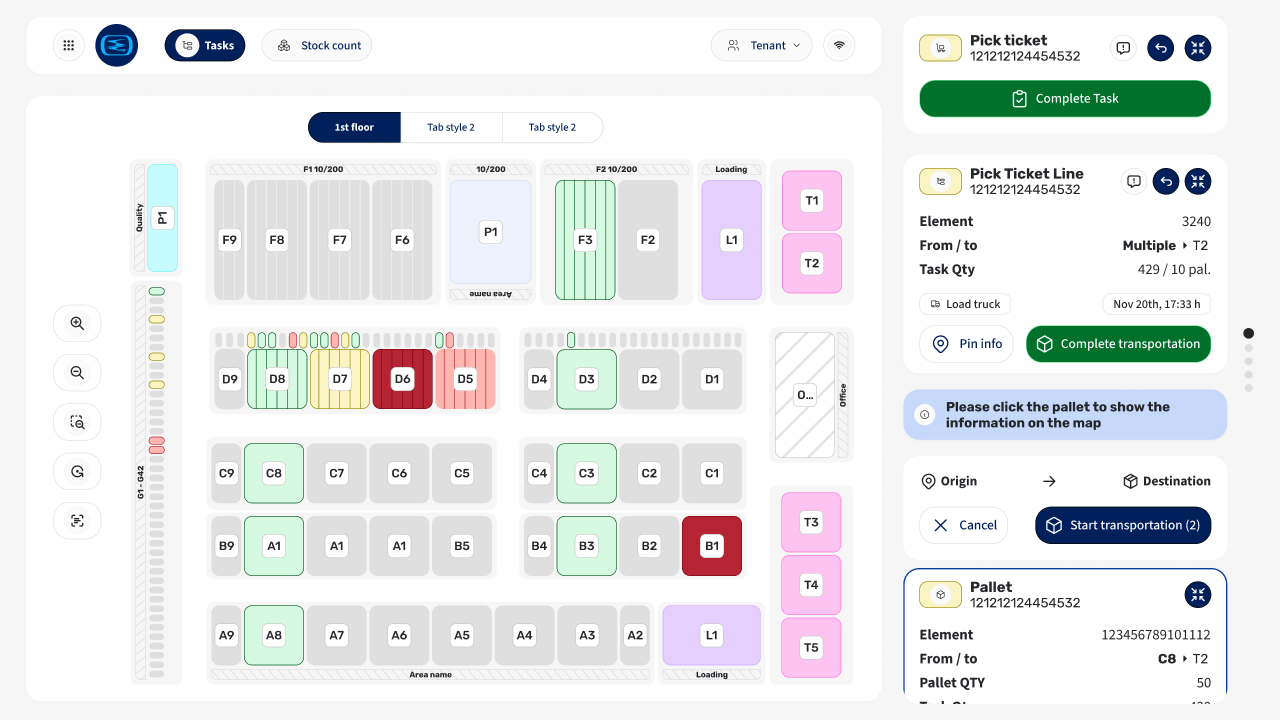
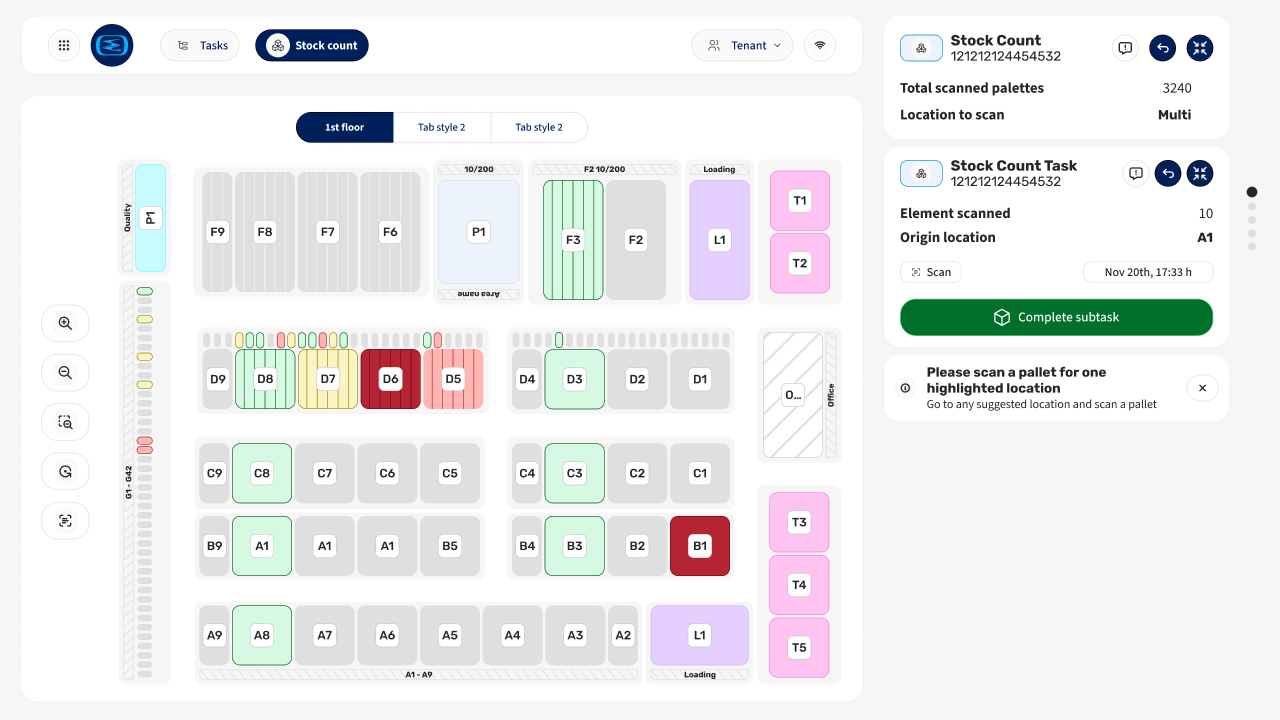
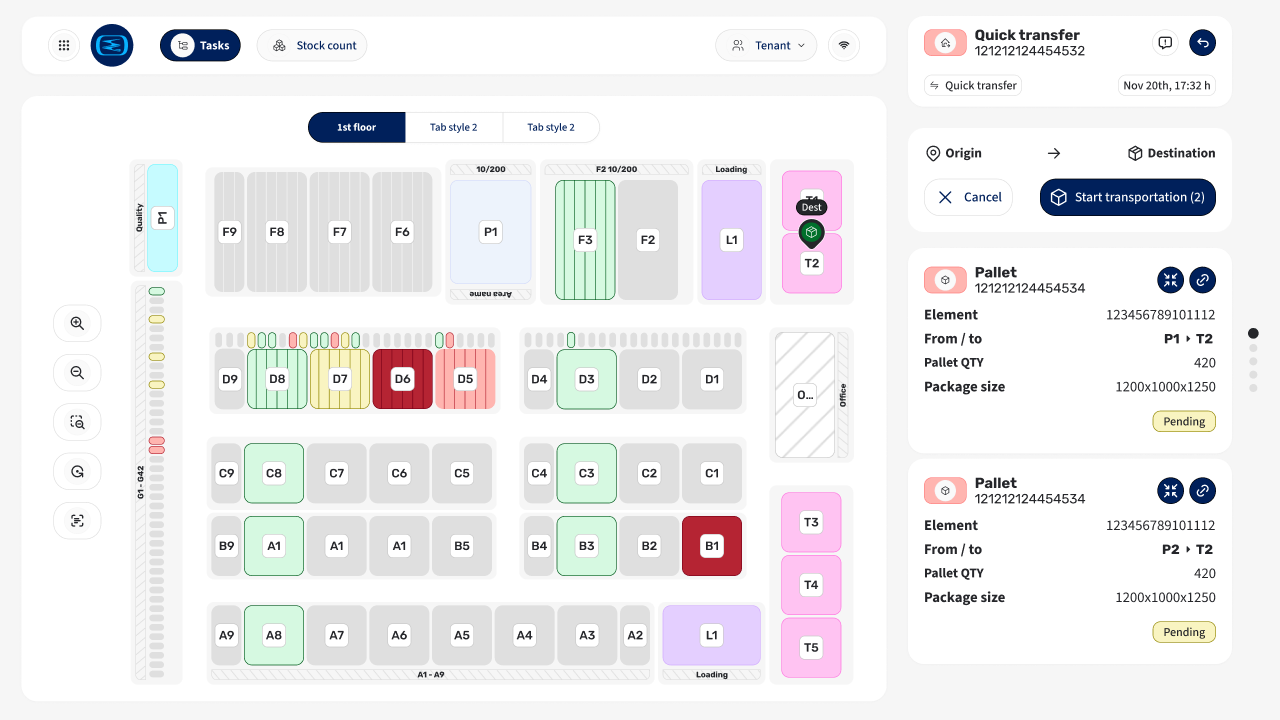
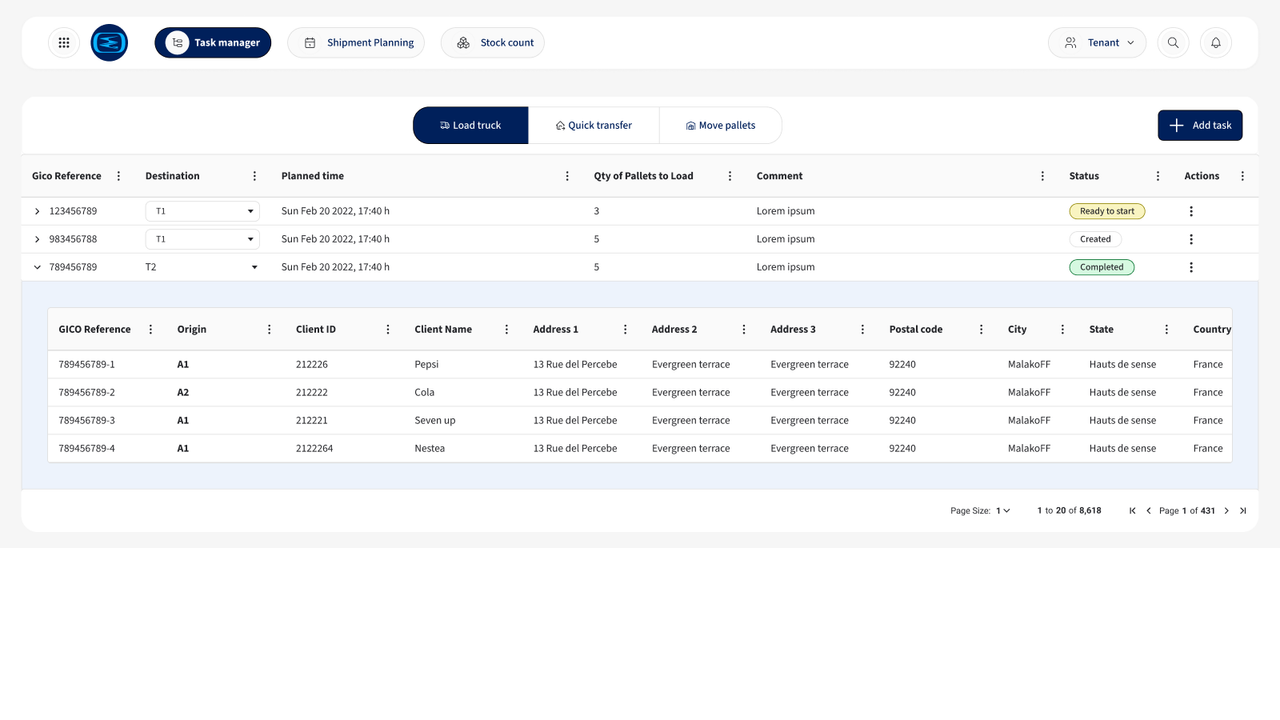
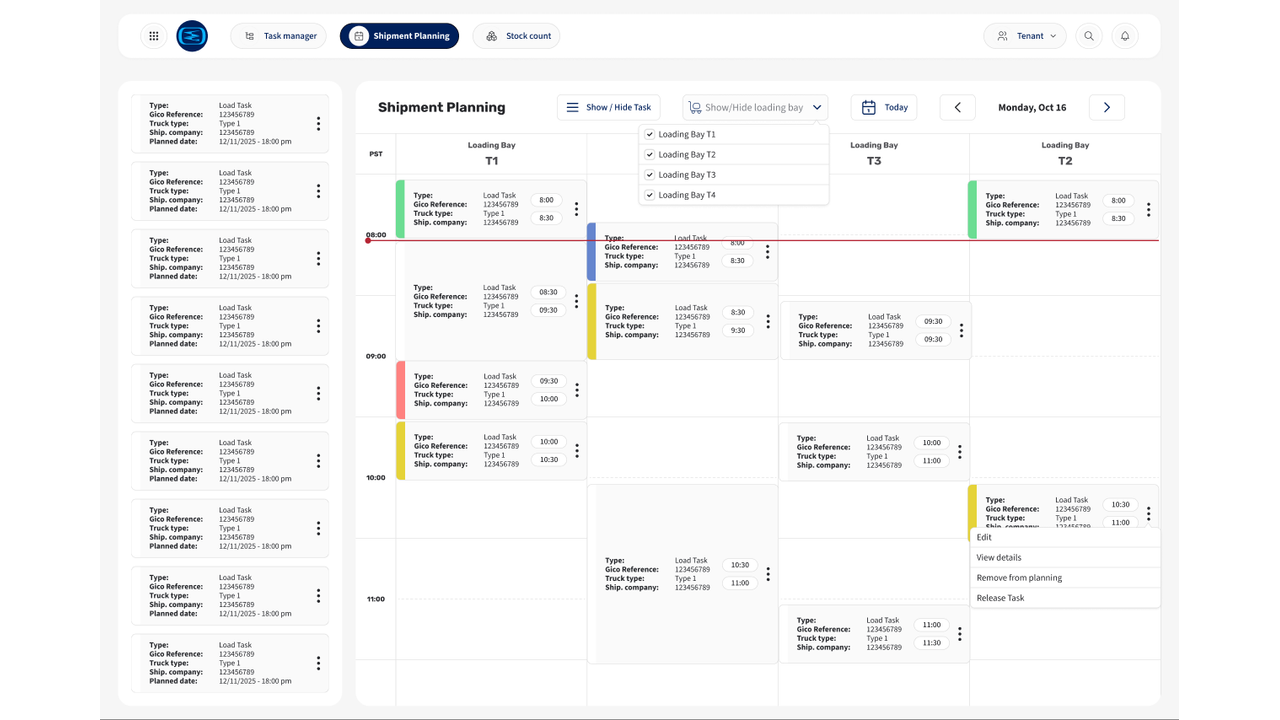
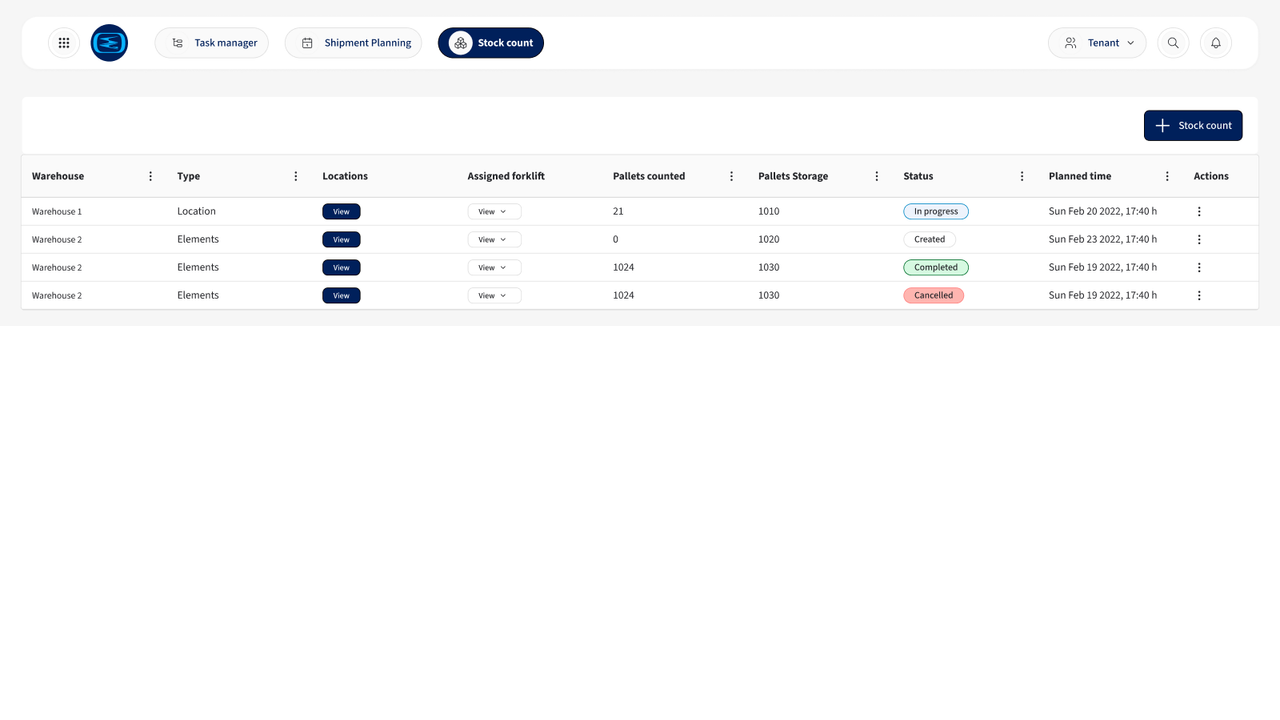
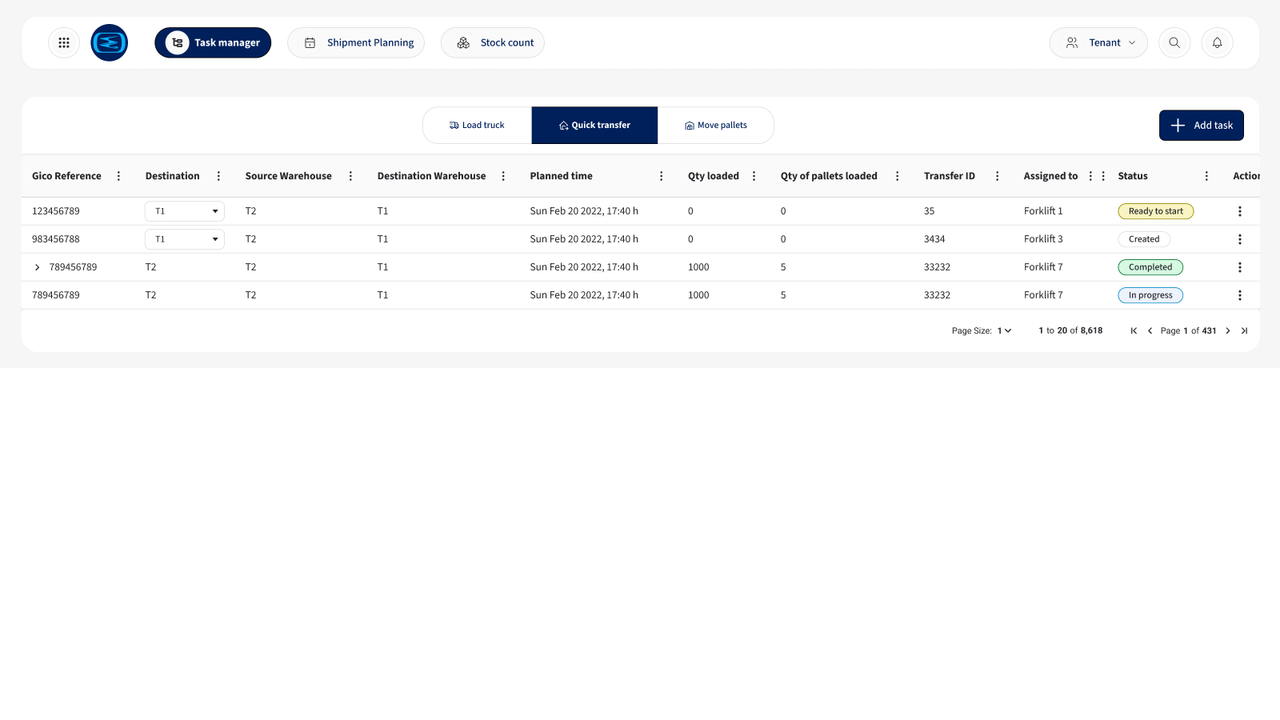
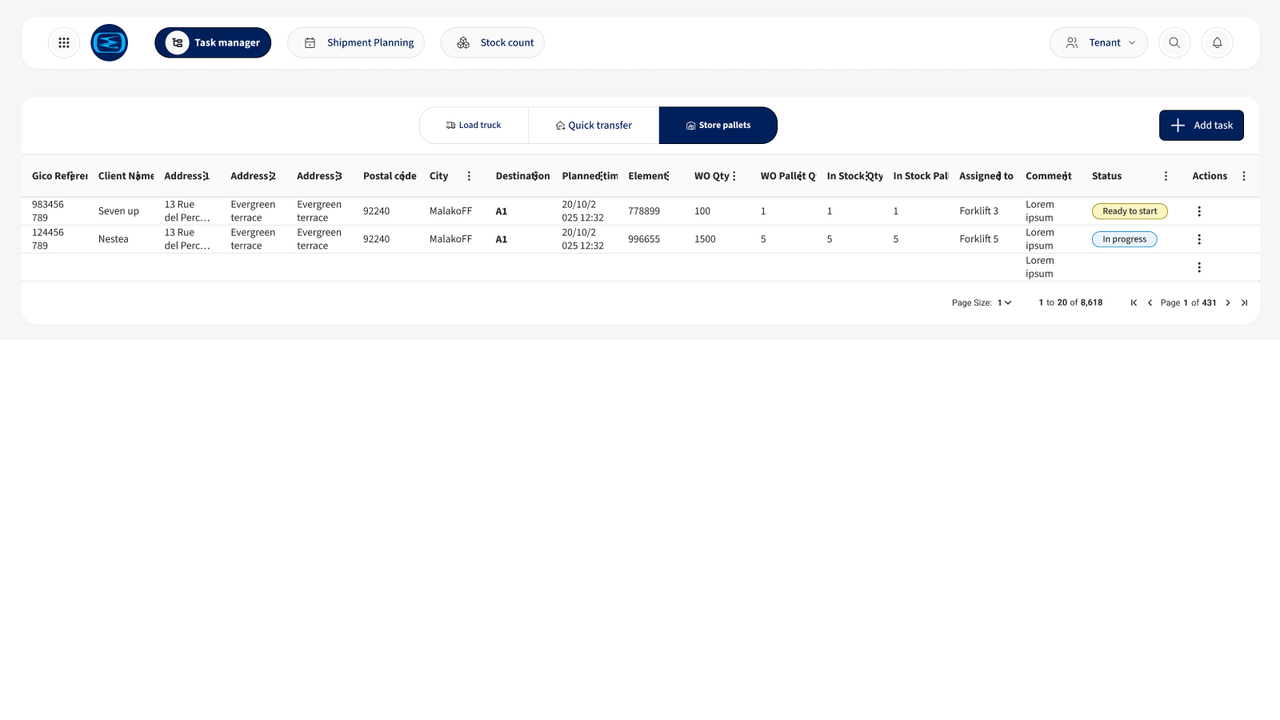
The warehouse MVP connected a desktop planning view with the forklift-mounted tablet. Coordinators could organise assignments and follow shipment work; drivers could see their task queue, identify and scan pallets, and confirm movements. The design also made warehouse zones and available space visible, helping a driver understand where a pallet could go instead of relying only on memory or a floor label.
- Plan and revise assignments in the coordinator's desktop view.
- Show zones, pallet locations and available capacity on the warehouse map.
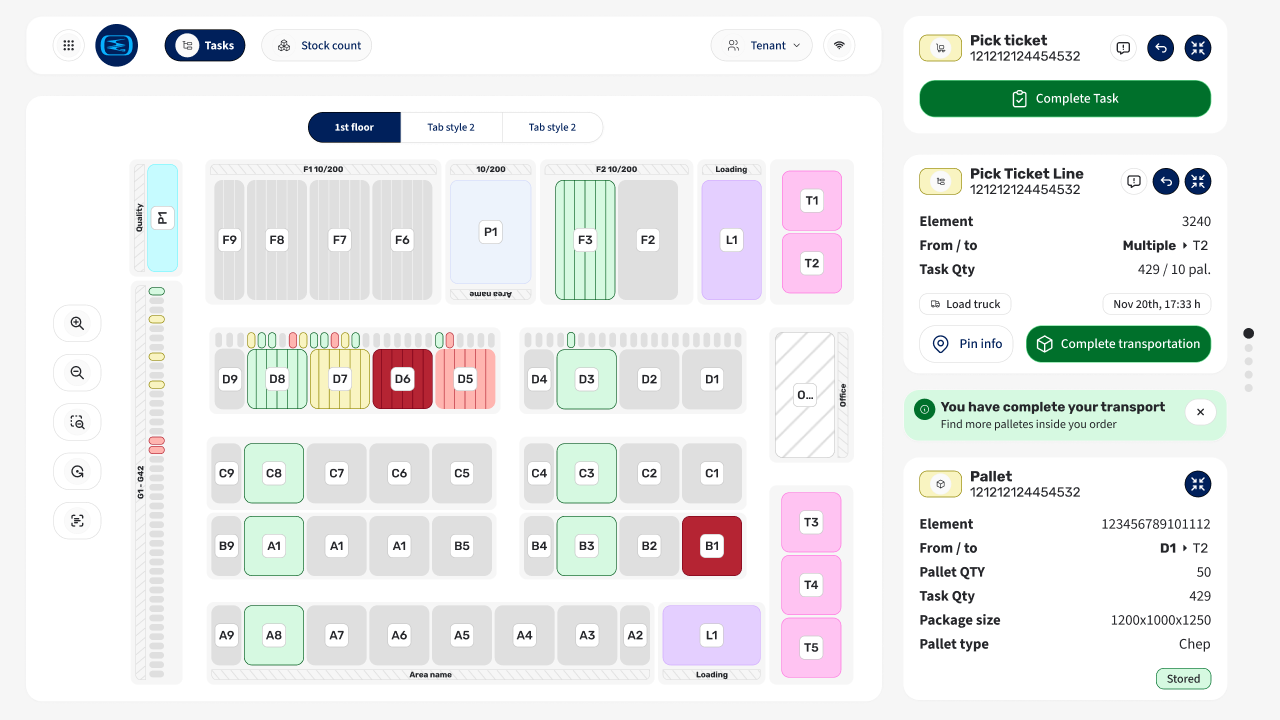
- Guide scanning, movement and loading with touch-friendly actions.
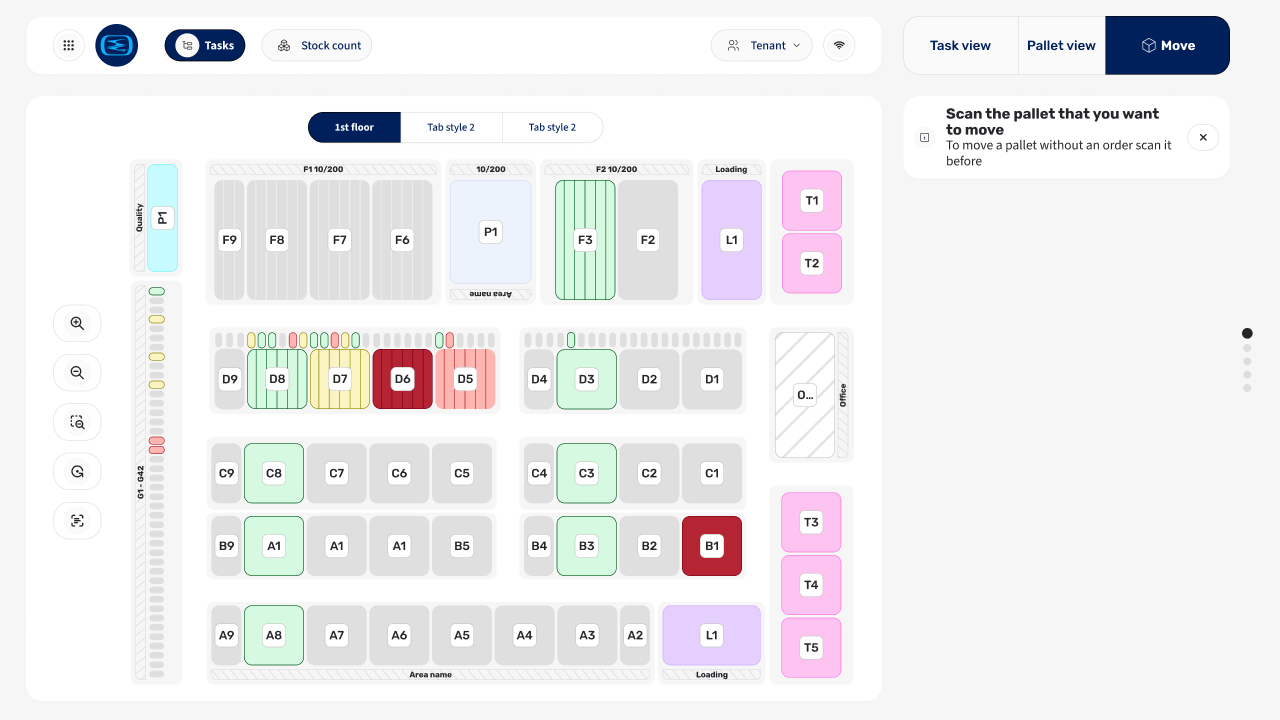
- Track task progress and allow a recorded manual move when needed.
MVP interface
One workflow, two perspectives
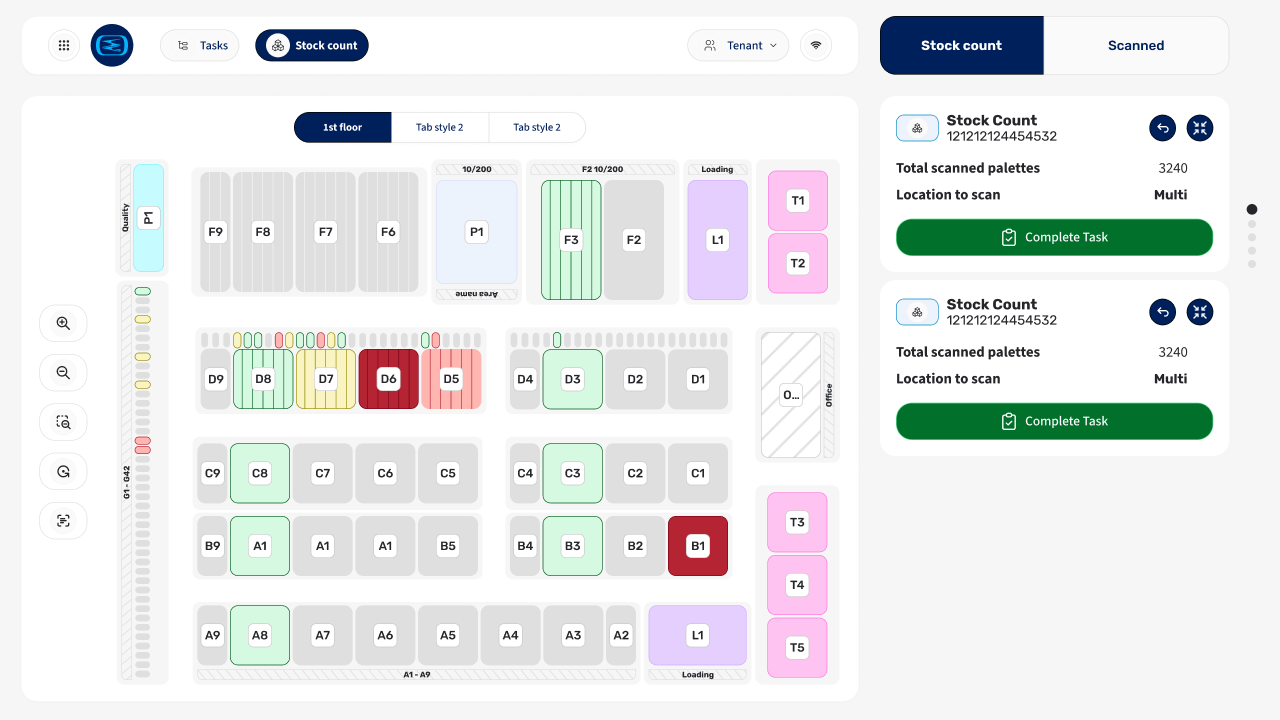
I developed the interface module by module with product and engineering. Drivers could follow a task on the mounted tablet, scan a pallet, see its destination, work by batch where appropriate and follow progress. Coordinators could connect assignments to load and shipment status. A recorded manual move remained available when the planned route did not fit the physical situation. This added an exception path, but avoided forcing operators to follow a plan the warehouse could not support. Figma branches distinguished approved hand-offs from ongoing iterations. The gallery shows design hand-offs, not screenshots captured from a live deployment.
Final Results
The first result was a shared direction. Field research, interviews and the feature map gave product owners and the eight-person development team a way to decide what belonged in the MVP and what should wait. Stakeholders supported the phased roadmap, and the team could work from reviewed flows rather than disconnected assumptions about the legacy system.
Over the year, I delivered the warehouse MVP interface and a Design System that developers were implementing in weekly increments. Approved Figma branches made each hand-off clearer as the product evolved. Following the final presentation, stakeholders rated their satisfaction between 9 and 10 out of 10. This reflects stakeholder assessment of the work, not an operational efficiency measure. The team had a two-to-three-year roadmap and a reusable foundation for continued development. Reductions in loading time, inventory errors and operating costs were intended benefits; they were not measured within the evidence presented here.